It’s Tuesday after Labor day in the US, and markets are back in full swing. Those who have been around the financial asset markets for a while will be well aware that this is when things really start to hear up. Autumn/winter is traditionally a top period for volatility in the finance space, and over the last couple of years, the bitcoin price seems to have followed suit. Traders are back at their desks after the summer break, people spend more and more of their evenings inside in front of screens, and this means only one thing: volume. Volume is key to volatility (low floats aside, but that’s not particularly relevant here) and we expect plenty of it over the coming months.
So, with this in mind, and as we head into a fresh weeks’ worth of trading (sort of…) let’s get down to the nitty gritty and see if we can’t pick up a nice profit from the market on today’s bitcoin price session.
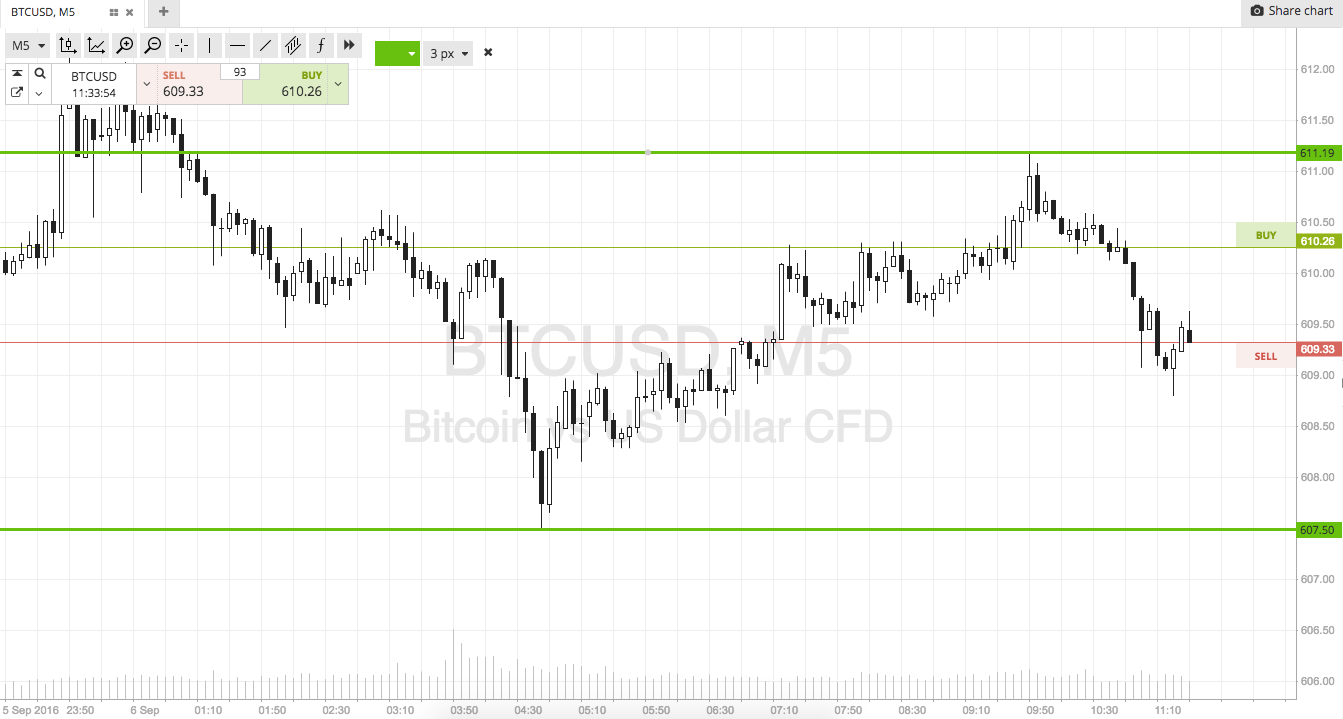
As ever, take a quick look at the chart below to get an idea of the levels in focus before we get started. The chart is a five-minute candlestick chart showing the last twelve hours’ worth of action in the bitcoin price, and has our key levels overlaid in green.

So, as the chart shows, the levels in focus for today’s session are in term support to the downside at 607 and in term resistance to the upside at 612. It’s a pretty tight range, so we are going for a breakout approach only on today’s session.
Specifically, if we see a break above in term resistance we will look to get in long towards an immediate upside target of 617. Conversely, a close below support will put us short towards a downside target of 600 flat. A stop just the other side of the entry level on both counts defines risk.
Happy Trading!
Charts courtesy of SimpleFX


