And we are off for another week in our bitcoin price trading efforts, and there’s plenty to discuss right out of the gates. Price towards the end of last week brought things to trade at fresh highs, and we were looking for these highs to give us something to go at over the weekend. As it turned out, we got plenty of action throughout the Saturday and Sunday session, and we’re heading into this week with some nice solid key levels to go at.
How things play out this week is anybody’s guess – though we’re hoping that we’ll see some of the same sort of action that brought us to trade at current levels in and around 1361. That said, there’s always the potential for a correction, and that might bring with it a bit of near term weakness. If things turn out that way, then we’ll be ready to get in as and when the markets signal entry.
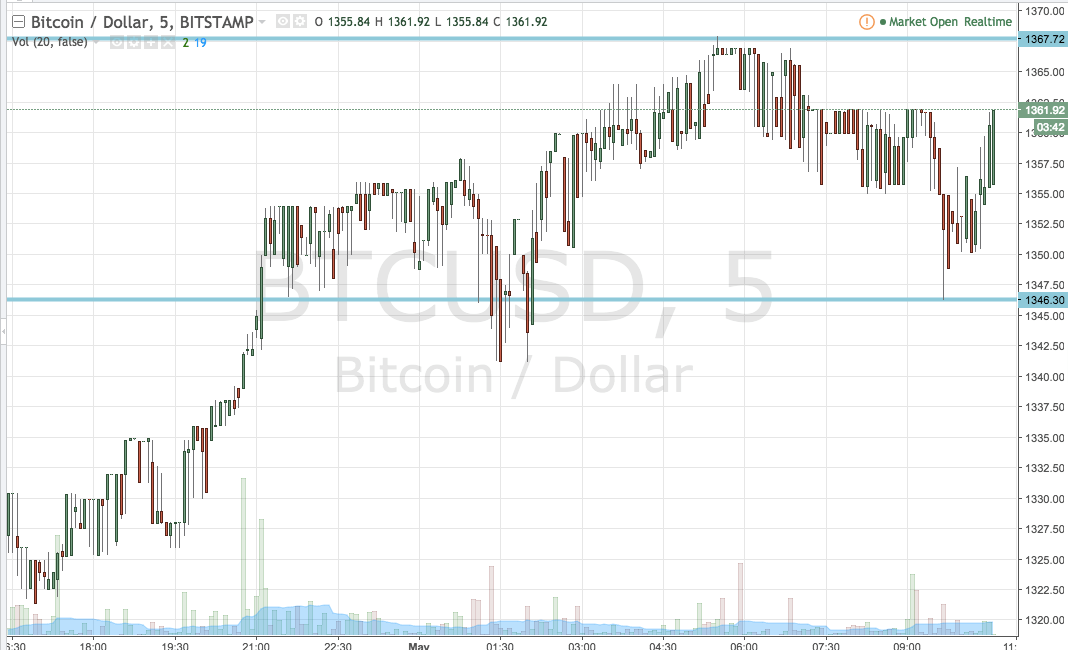
Anyway, let’s get to today’s action. Before we get started, take a quick look at the chart below. It’s a five-minute candlestick chart and it’s got our key range overlaid in green.

As the chart shows, then, the range we are going at during the session today is defined by support to the downside at 1346 and resistance to the upside at 1367. There’s plenty of room for an intrarange strategy here, so if we see a bounce from support we’ll be in long towards resistance, and similarly, we’ll be in short towards support on a correction from resistance.
Looking at breakout, if we see a close above resistance, we can get in long towards an upside target of 1380. Looking the other way, a close below resistance will signal an entry towards 1330. Stops on both positions just the other side of the entry will ensure we’re taken out of the trade in the event of a bias reversal.
Charts courtesy of TradingView


