If you read our bitcoin price watch analysis this morning, you’ll be aware that we were looking at 1000 flat as a key indicator level during the day. We said that if we see a close above the 1000 level on the intraday charts, it would almost certainly precede a run through the 1020 region and perhaps as high as 1030. Parallel to our standard intraday strategy, then, we set up a secondary trade in line with this assumption. Specifically, we’d get in long on a close above 1000 and target the 1020 level to the upside.
As things turned out, this trade played out pretty much to the letter. Shortly after we set up our key levels, price started to run, and we got in two separate trades on the back of the action. The first was a long towards 1010 on a close above in term resistance, and the second was the above discussed 1000 cross entry.
Both trades played out in our favor, and we’ve managed to make the best of a bad situation (some overarching bearish sentiment) as a result.
With any luck, we’ll get a return to the upside momentum this evening. Price is currently in something of a consolidation phase, and we’re expecting a breakout from this phase any time now.
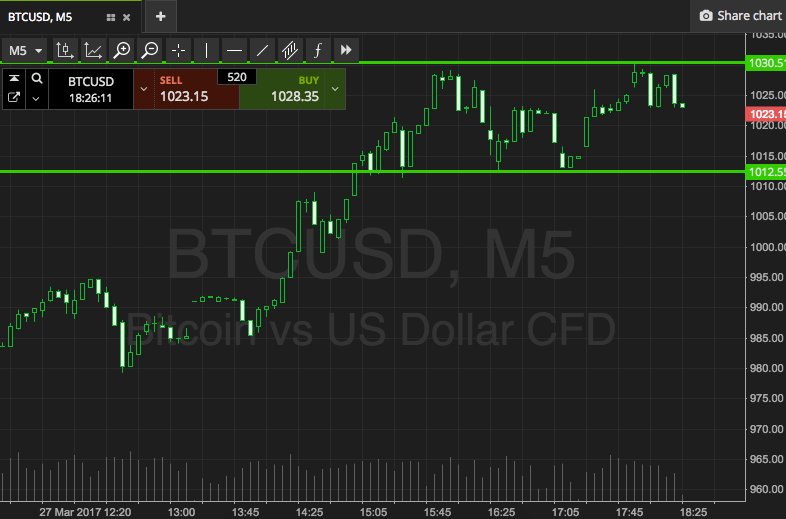
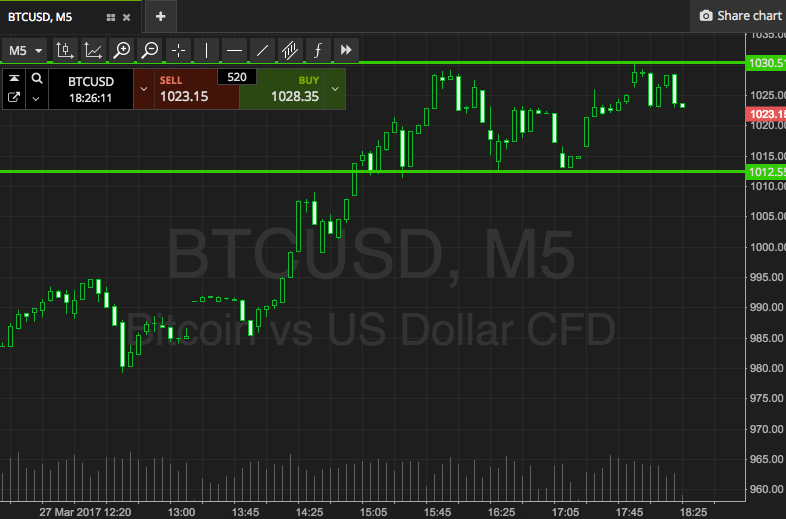
So, take a look at the chart below to get an idea of our key levels this evening.

As the chart shows, the range we are going at now is defined by support to the downside at 1012, and resistance to the upside at 1030. Tight range, tight targets and stops.
If we get a close above resistance, we’ll get in long towards 1038. Stop at 1028. Conversely, a close below support will get us in short towards 1005. Stop at 1015 on this one to kill risk.
Let’s see how things play out.
Charts courtesy of SimpleFX


