Well, here we go, the first of our final two analyses of the bitcoin price this week. As we have said on a number of occasions, price has been really volatile this week, and as a result, we have had plenty of opportunities to get in and out of the markets according to our intraday strategy. Both our breakout strategy and our intrarange strategy have come into play at various points in time, and with any luck, we will be able to bring both into play one final time this week and end the week on a high. So, with this in mind, and as we head into the early morning European session, let’s get some key levels outlined, and see if we can’t finish off the week in the same fashion we came into it.
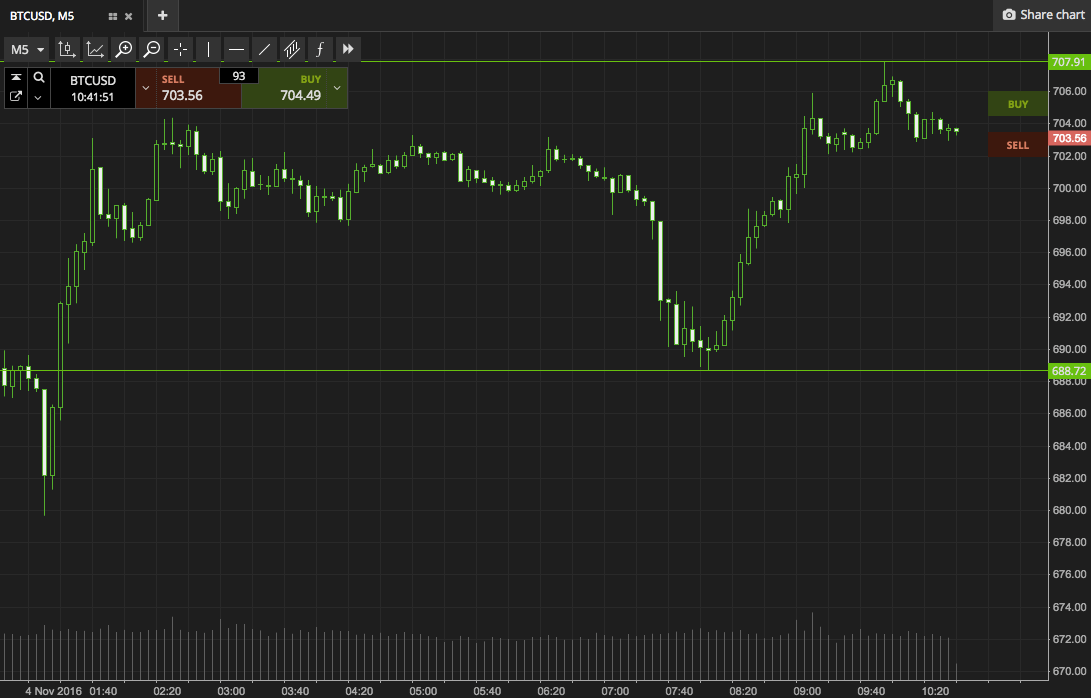
As ever, take a quick look at the chart below to get an idea of where we are looking before we get started. It is a five-minute candlestick chart, and it has our range overlaid in green.

The first thing you will notice is that our range is far wider today than it normally is. Price has given us some pretty solid key levels, and we’re going to go with these in an attempt to use intrarange as a primary approach. This is a little bit unusual for us, but we have had a good week, so why not.
Support comes in at 688 to the downside, while resistance comes in at 707. Price is currently a little closer to resistance, so we will address that first. On an intrarange basis, if price corrects from resistance, we will enter short towards support. A stop loss just above 707 (somewhere around 710) will ensure we are taken out trade in the event of a bias reversal. Looking the other way, if price bounces from support, we will enter long towards resistance, again with a stop loss, this time just a few dollars below support to maintain our risk profile on the trade.
Charts courtesy of SimpleFX


