So that’s the week complete in our bitcoin price trading efforts and – as we noted this morning – it’s been a pretty good one. We were hoping for a bit of volatility during the session today in the sense that things were relatively quiet overnight and we thought we may see a breakout of the consolidation phase as and when price found its feet.
As it turns out, we’ve not seen too much in the way of volatility and – as a result – we’ve not had much in the way of opportunity to get in and out of the markets according to the rules of our intraday strategy.
Not to worry. We’ve still got the US session this afternoon, and we should be able to push for some signals as action matures into the weekend.
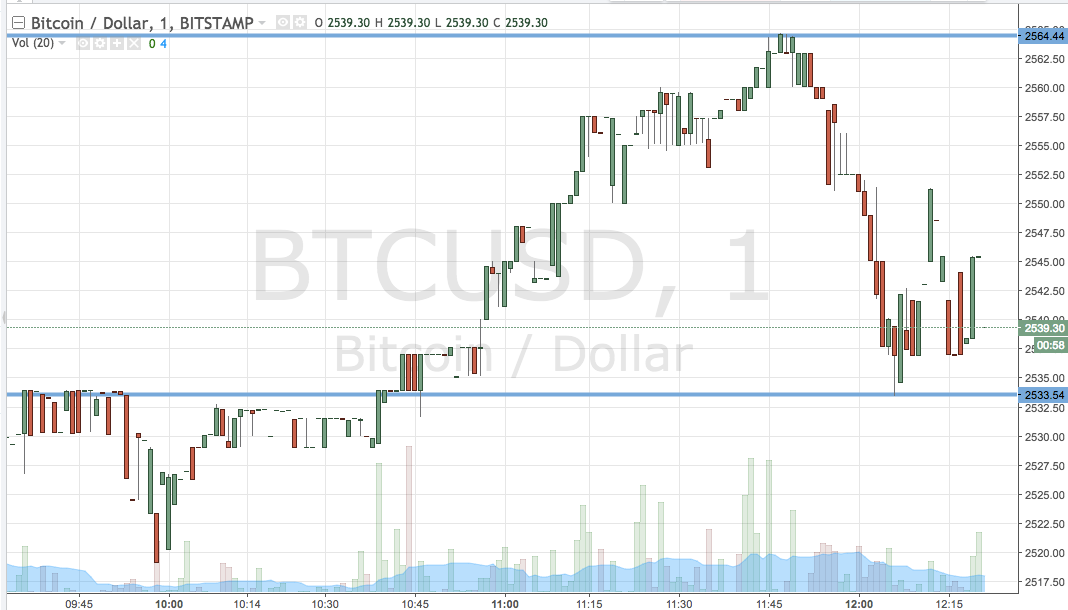
So, as we head into the US afternoon this evening, and as we look forward to the weekend, here’s a look at where we are going to get in and out as and when price moves. As ever, take a quick look at the chart below to get an idea of what’s on and how price moved today. It’s a one-minute candlestick chart (as usual) and it’s got our key range overlaid in blue.

As the chart shows, the range we have in our sights for this evening is defined by support to the downside at 2533 and resistance to the upside at 2564. We’re going to look out for a close above resistance initially to get us into an upside entry towards a target of 2590. A stop on the position at 2555 looks good from a risk management perspective.
Looking the other way, if we see a close below support we are going to get in short towards 2500 flat. A stop on this one at 2540 looks good.
Let’s see what happens…
Charts courtesy of Trading View


