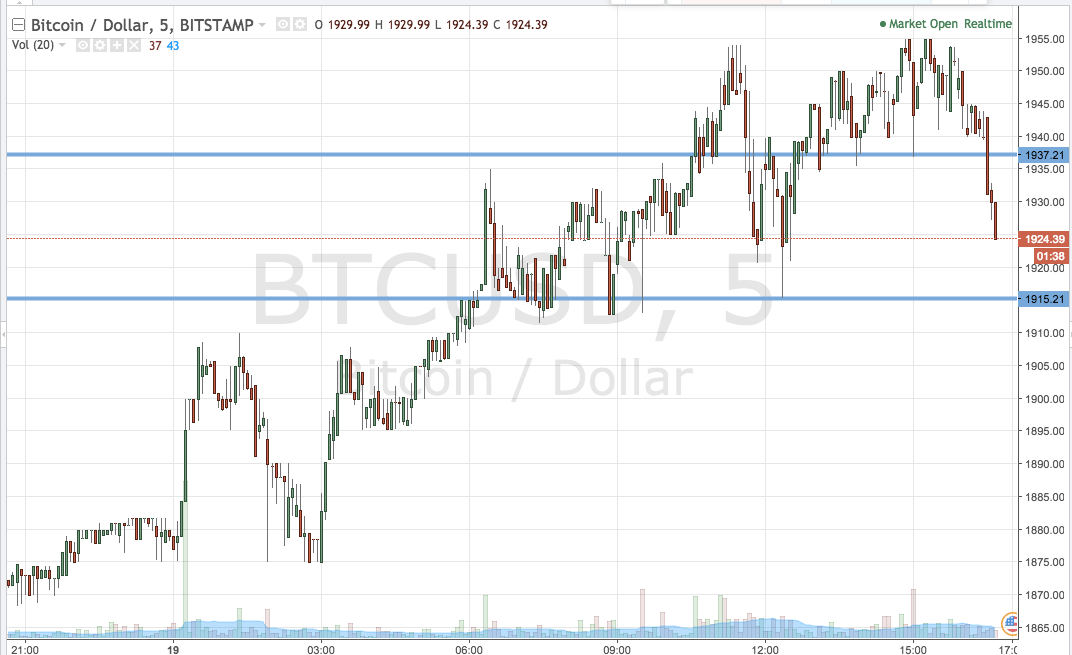
So that’s another day done in our bitcoin price trading efforts, and after a few days away from the screen, we’ve seen some pretty interesting action. Price was relatively flat at the very start of the week but picked up quickly as the midpoint hit and eventually ran to break the 1800 mark, the 1850 mark, the 1900 level and – as of today – the 1950 level. That’s a considerable run considering we were looking at 1000 and less in the not too distant past, and one that looks almost certain to continue as added market attention comes into play and feeds the speculative fire.
As ever, while it’s nice that we’re seeing a longer term appreciation in price, from an intraday perspective, the best thing is that we’re getting some movement. Sideways action is tough to trade so when we see sustained momentum, be it to the up or downside, it works for us.
Of course, longer term value add is never a bad thing.
Anyway, let’s get to the key levels for this evening. Get a quick look at the chart below to get an idea of what’s on and where we are looking to get in and out of the markets according to the rules of our intraday strategy this evening. It’s a five-minute candlestick chart and it’s got our key range overlaid in green.

As the chart shows, the range we are looking at for the session tonight is defined by support to the downside at 1915 and resistance to the upside at 1937. We’re going to be on the lookout for a close above resistance as indicative of a bullish entry signal towards a target of 1955. Conversely, a close below support will get us into a short trade towards a downside target of 1900 flat.
Let’s see how things play out.
Charts courtesy of Trading View


