Okay then, let’s get things kicked off for a fresh week in the bitcoin price. Before we get started, it’s worth recapping quickly for those fresh to our strategy what happened recent term, and how this impacts current price. Basically, price gained towards 1300 into the end of December, and then throughout early to mid January, seemed to give back the vast majority of these gains and collapse back down to the 700 region. Since then, a long period of consolidation (just shy of a week) and then some step up gains have brought a bit of stability to price, but we are yet to see the gap close.
Over this last weekend, however, price has made a substantial move to the upside, and while the full gap remains to be closed, there is some indication that this could happen quite near term.
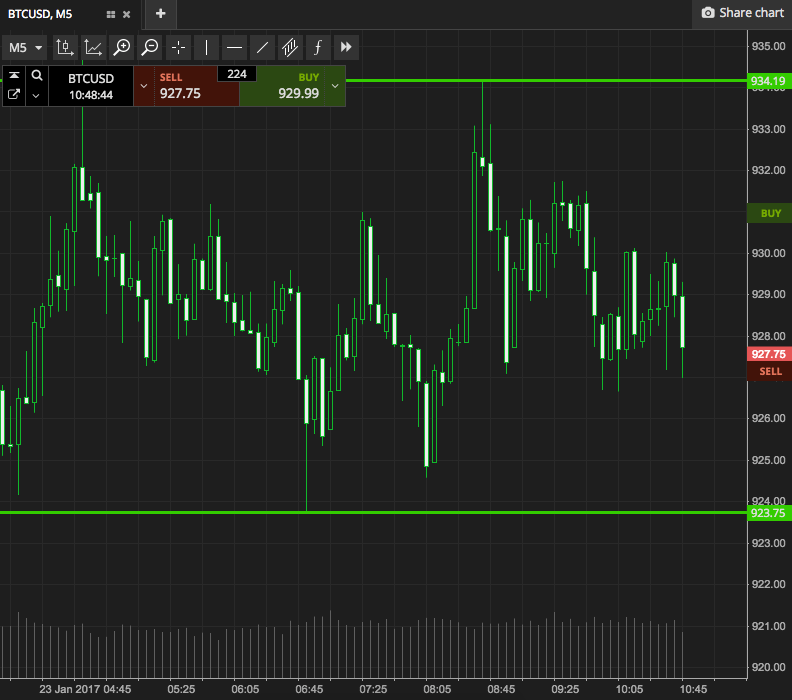
So that brings things up to date, where are we looking today? Take a look at the chart below to get an idea of the levels in focus, and where we are looking to get in and out of the markets according to our intraday strategy.

As the chart shows, the range for today is defined by 923 to the downside for support, and 934 to the upside as resistance. We’re going to focus on price primarily with our breakout strategy today, so if we see action break above resistance, we will look to get in long towards an immediate upside target of 944. A stop loss on the trade at 930 will work to define risk and take us out of the position in the event of a bias reversal.
Conversely, if price closes below support, we will enter short towards 910 flat. This one is a little more aggressive, and gives us a little more room on the stop loss, so somewhere in the region of 928 works well.
Charts courtesy of SimpleFX


