It is Monday morning, and time to take a look at how action over the weekend played out, and in turn, how we can interpret this action as far as forming a trading strategy for today is concerned. As ever, we’re going to put together two intraday analyses, with the first one looking at the early morning European session and the second looking at action heading into this evening and, beyond that, into the Asian session tonight.
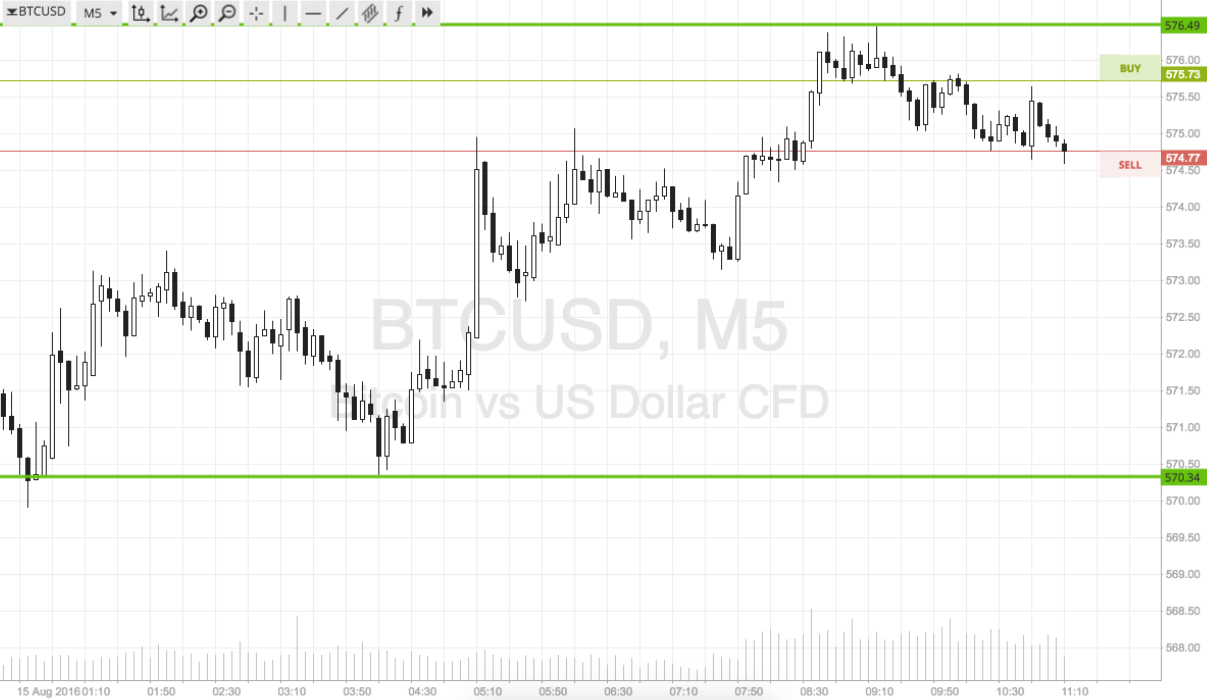
So, let’s get started. Action over the weekend was pretty flat, and the trend we saw throughout the majority of last week – sideways, range bound action with a few intraday breakouts – held firm. We got a little bit of a downside break earlier this morning, but it didn’t give us too much to play with as far as breakout strategy is concerned. However, it has defined a pretty solid range, and this is what we are looking to use going forward today. So, before you start, take a quick look at the chart below. It is a 15-minute candlestick chart showing the last 12 hours or so worth of action, and it has our range in focus overlaid in green.

As the chart shows, the range we’re focusing on this morning is defined by support to the downside at 570 and resistance to the upside at 576. Price is currently trading pretty much midrange, with a slight downside bias, so we will look at the short side first. If price breaks below support, we will look to enter a short trade towards an immediate downside target of 565. A stop loss on the position somewhere in the region of 572 defines risk nicely.
Conversely, if price breaks and closes above resistance, we will put in a long position towards 582. On this one, a stop somewhere in the region of 574.5 works to keep risk tight.
Charts courtesy of SimpleFX


