Another day, another dollar or ten in the bitcoin price. Things have started to move now and it looks as though we are going to get a pretty decent run as we head into the mid week activity. Price hasn’t done anything spectacular in terms of sustained momentum (in fact, we are going to close out the day at pretty much the same spot at which we started it), but it has moved, and choppy action is as good as volatile momentum if our levels are set up correctly.
And it seems that today, at least, they were.
So we managed to pull a quick profit from the market today on the way up, and we also did the same on the way down. We now have the US afternoon to look forward to, and hopefully, it will bring with it much of the same sort of action. We are going to widen out our range a little in an attempt to go after some slightly expanded targets, but other than that, things remain relatively straightforward and in line with our earlier coverage.
With this noted, then, let’s get some key levels outlined, and get things going.
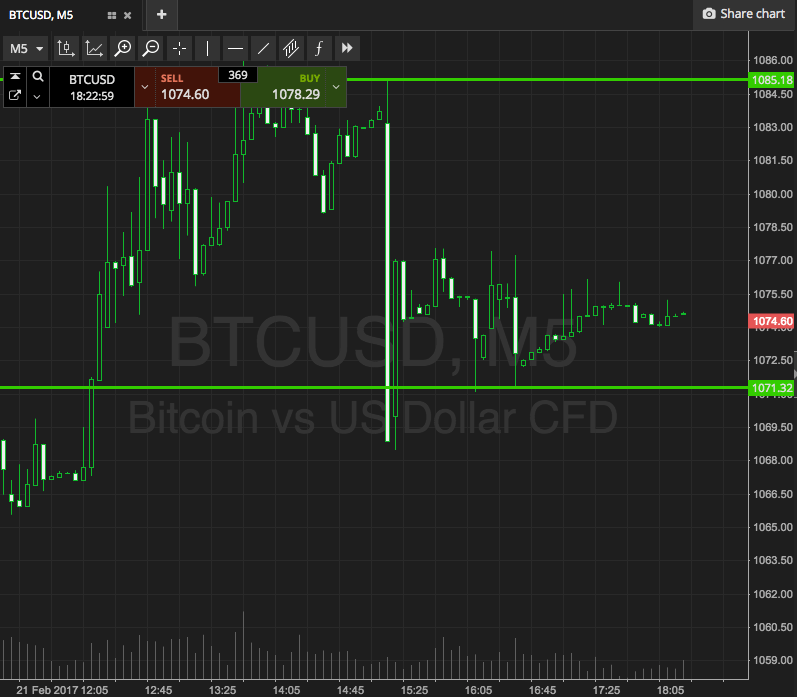
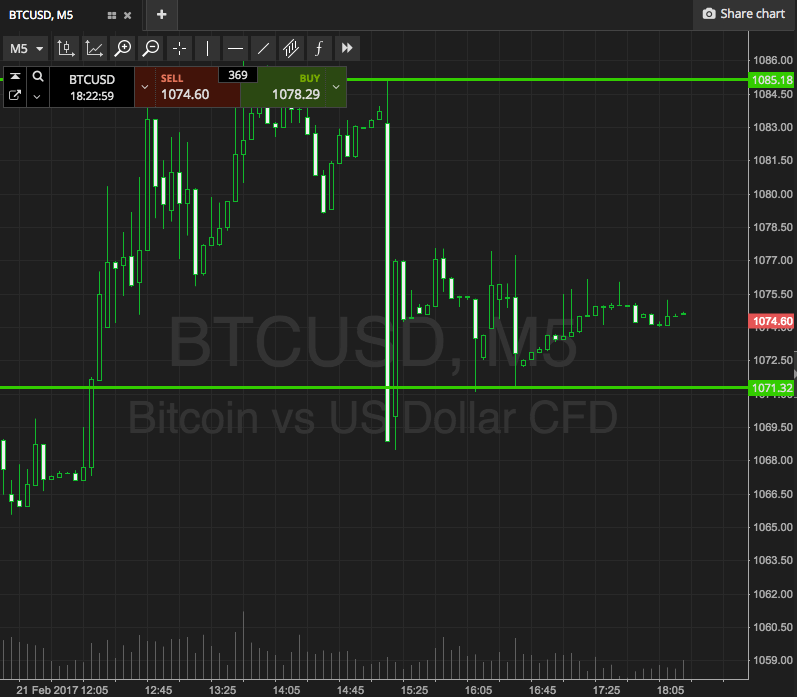
Take a look at the chart below to get an idea of what’s on, and where we stand in terms of range, price and momentum. It’s a five-minute candlestick chart, as ever, and it’s got our key range overlaid in green.
 As the chart shows, the range in focus for the session is defined by support to the downside at 1071, and resistance to the upside at 1085. If we see price break through the latter of these two levels, we will enter long towards 1100. A close below support will put us short towards 1060. Stops, as ever, keep our risk defined and ensure we are taken out on a bias reversal.
Charts courtesy of SimpleFX


