So the day has now drawn to a close, and it’s time to take a look at how things played out, and how we can interpret the action we saw during the session as far as putting together an actionable strategy for this evening is concerned.
Volatility looks to have finally returned to the markets, in all likelihood it’s because of the volume boost we have discussed in the last few analyses, and this has meant we’ve had the opportunity to get in and out on a couple of nice breakout trades. Quick profits, low risk, scalp entries – exactly what we like to see and play.
Today’s session brought with it a bit of up and down action, and has given us a chance to define a pretty solid range for this evening’s session. We are heading into the close of the US session shortly, and beyond that, the Asian session should kick off and start feeding into the volume data. During the lull, things might be a little quiet, but at Asian open things will likely kick off again.
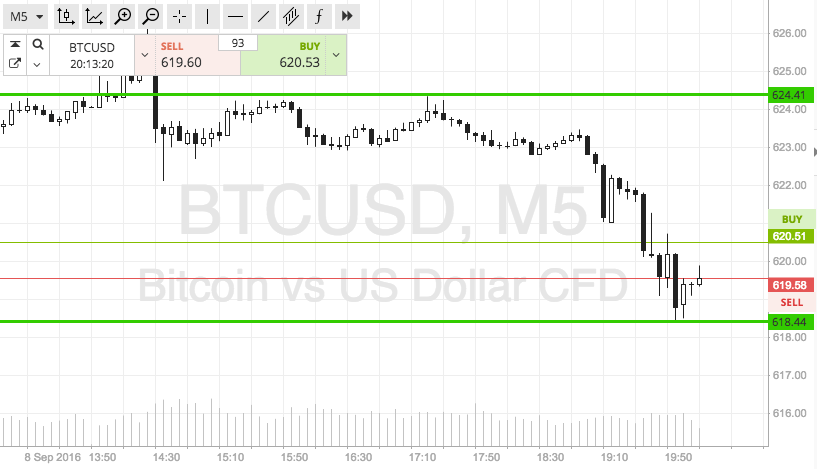
So, with this in mind, let’s take a look at what we are going at this evening, and try to outline some key levels and exit positions for our strategy. As ever, take a quick look at the chart below to get an idea of what’s on, and where we are looking. It’s a five-minute candlestick chart showing twelve hours’ worth of action, and our range in focus is overlaid in green.

As the chart shows, the range we are looking at is defined by in term support to the downside at 618, and I term resistance to the upside at 624.
We are going to watch for a close above resistance to put us long towards an immediate upside target of 630 flat. A close below support will signal short towards a downside target of 610. Stops just the other side of our entries will define risk on the positions.
Happy trading!
Charts courtesy of SimpleFX


