That’s another week of trading complete in our bitcoin price trading efforts and we’ve had a pretty fantastic week as far as profit and loss are concerned. Things got moving with a strong US session on Monday and price hasn’t really looked back since. We’re now teetering on the edge of highs that, when price declined back at the start of the month, mainstream media suggested we’d not see again for a considerable period and with a bit of a push over the coming weeks these highs could very quickly be in the rear view mirror.
We’ve got the US afternoon left before things close out for the week and volume dips heading into the late night session on Friday. There’s a good chance we’ll see some volume over the weekend (we pretty much always get a solid move throughout Saturday and Sunday, but this afternoon’s session is likely to be our last opportunity of the week to take a swipe at the markets.
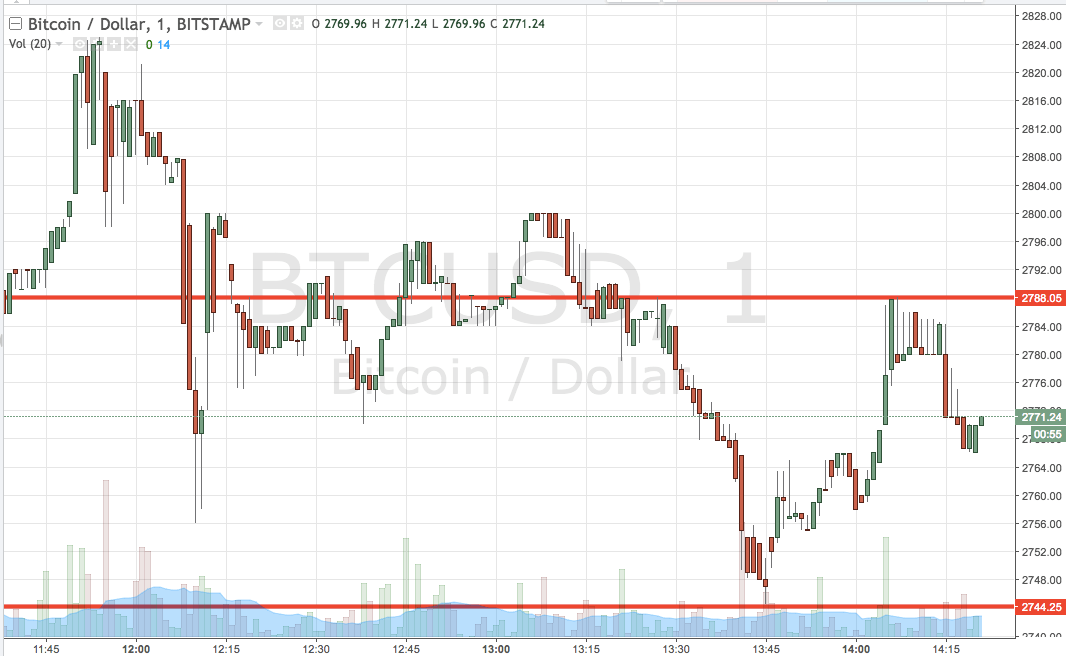
So, with this noted, let’s get some key levels in place with which we can approach the action and see if we can put our strategy to work. As ever, take a quick look at the chart below before we get started to get an idea where things stand right now. It’s a one-minute candlestick chart and it’s got our key range overlaid in blue.

As the chart shows, the range we are focusing on for the session this evening comes in as defined by support to the downside at 2744 and resistance to the upside at 2788. If we see price break above the latter, we’re going to get in long towards an upside target of 2810. Conversely, a close below support will have us in short towards a downside target of 2710.
Let’s see how things play out.
Charts courtesy of Trading View


