So that’s another weekend gone and all of a sudden a fresh week of trading is underway in the bitcoin price. It’s been a pretty wild ride over the last few weeks and especially as relates to the last five or six days, with price soaring to fresh all-time highs before correcting pretty substantially towards current levels in and around the $15,000 mark.
Nobody can really say with any certainty what’s going to happen from here but, if our strategy is to be trusted, it doesn’t really matter all that much. So long as price eventually resumes its longer-term overarching upside momentum then we can pretty happily trade any intraday volatility with our breakout strategy and hedge against any downside runs on the longer-term charts.
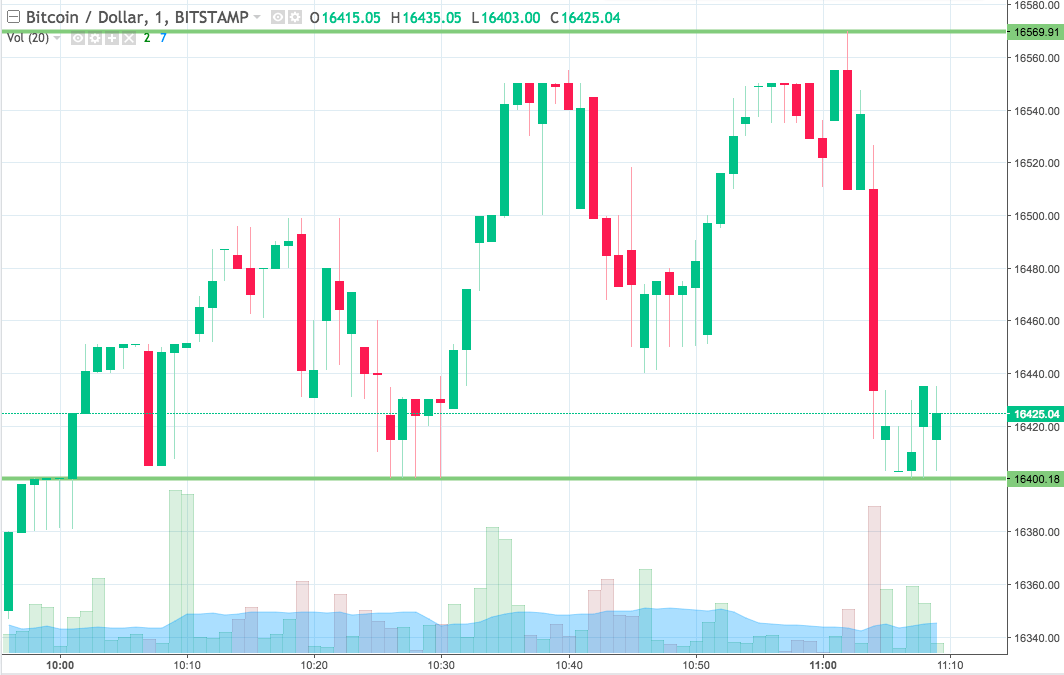
So, with that said, let’s get some levels in place that we can use to draw a profit from the market today. As ever, take a quick look at the chart below before we get started so as to pick up an idea where things stand and where we are looking to jump in and out of the markets according to the rules of our strategy.

As the chart shows, the range we are looking at for the session today comes in as defined by support to the downside at 16400 and resistance to the upside at 16569. We are going to stick with our standard breakout approach for the time being, so if we see price break above resistance, we will enter longer towards an immediate upside target of 16620. A stop loss on the position somewhere in the region of 16540 will ensure we are taken out of the trade in the event that things turn against us.
Looking the other way, if we see price close below support, we will enter short towards a downside target of 16320.
Let’s see what happens.
Charts courtesy of Trading View


