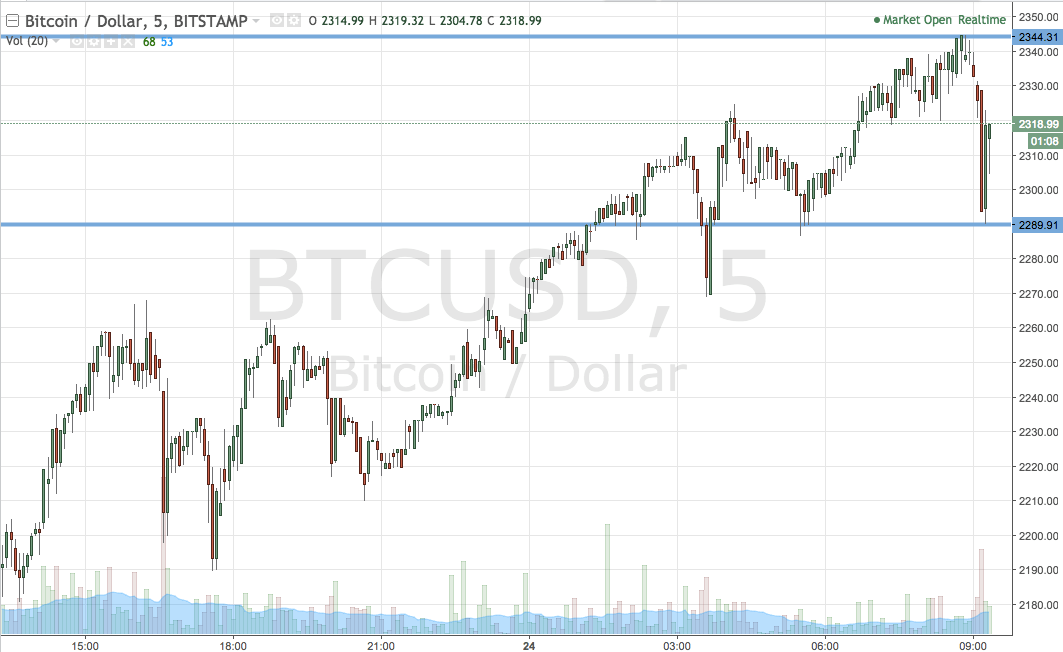
Alright then. It is time to get things kicked off for our first middle of the week bitcoin price analysis ahead of the start of the European session this morning. We keep saying it, but once again we have had some pretty noteworthy action overnight. The bitcoin price has literally made fresh highs daily for the past week or so, and as things stand, it doesn’t look like this is going to change anytime soon. A little earlier on this morning, price hit what represents an all-time high of 2344 and has since corrected to hover in and around the 2300 mark. We are going to be using this overarching range during the session today, but we will tighten things up a bit as far as strategy implementation is concerned before we get started.
So, with this noted, let’s get to the detail.
As ever, get a quick look at the chart below before we get started so as to get an idea of what is on. It is a five-minute candlestick chart, and we have a relatively wide range outlined in blue.

So, as the chart shows, and as we have just noted, today’s range is pretty wide as compared to some of our historic standard ranges, coming in as defined by support to the downside at 2289 and resistance to the upside at 2344. With price moving as it has been, it’s tough to approach the market with anything narrower than these parameters. Not that it makes too much difference to our entries, it just means that we are able to be slightly more aggressive with our targets if we do get a break.
So, if we see a close above resistance, we will look to get in long towards an upside target of 2370. Conversely, if price breaks below support, a close below this level will get us in towards 2260.
Let’s see what happens. Hold on tight!
Chance courtesy of Trading View


