Okay, let’s get things kicked off for another day of trading in the bitcoin space. Those who have followed our coverage across the week so far will know that we have managed to get in and out of the markets according to the rules of our intraday strategy on a number of occasions. When price moves with the type of upside momentum that we have seen this week, implementing our bitcoin price strategy becomes relatively easy. Set a range, get in on a break of the levels in focus, get out when our predefined exit levels are hit.
Overnight, price once again ran to the upside, and it looks as though we may see a relatively near-term continuation of the action we have seen recently. There may be a short-term correction (this normally happens as traders take profits off the table) but from a medium to long-term perspective, things look pretty strong.
With this in mind, here is a look at the levels in focus for today’s session, and where we are looking to get in and out of the markets as and when price signals us to do so.
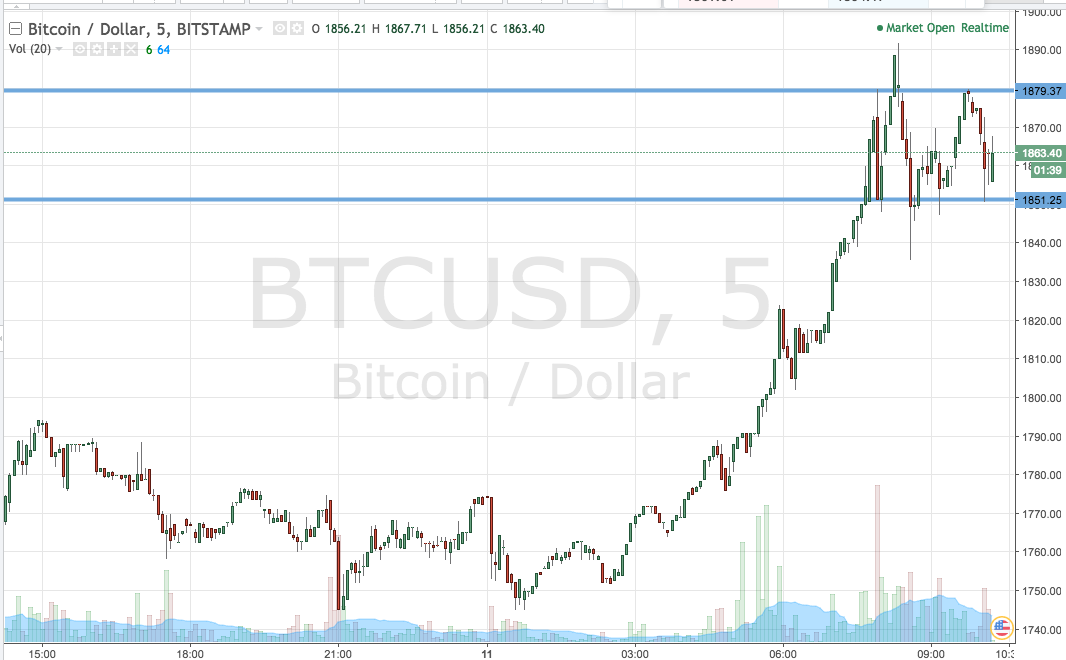
Take a look at the chart below to get an idea of what is on before we get into the detail. It is a five-minute candlestick chart and its got our key range overlaid in green.

As the chart highlights, the levels in focus for today’s session are support to the downside at 1851 and resistance to the upside of 1879. If we see price break up above resistance, we are going to look at getting in long towards an immediate upside target of 1890. Conversely, a close below support will put us into a short position towards a target of 1835. A stop loss on both positions just the other side of the entry points will ensure we are taken out of the trade in the event of a bias reversal.
Charts courtesy of Trading View


