Reason to trust

How Our News is Made
Strict editorial policy that focuses on accuracy, relevance, and impartiality
Ad discliamer
Morbi pretium leo et nisl aliquam mollis. Quisque arcu lorem, ultricies quis pellentesque nec, ullamcorper eu odio.
Okay then, let’s get things moving for another day’s trading in the bitcoin price. As we noted yesterday, price has been pretty volatile of late, and we have seen something of a correction in the markets this week. This wasn’t unexpected – a correction is a pretty standard event after a run of this magnitude, and in all honesty, the correction we have seen has been relatively minor compared to the upside preceding it – but it does make for somewhat jittery markets nonetheless.
Our strategy is able to cope with both upside and downside action, so in terms of drawing a short-term profit from the market, it’s not too much of a problem. From a long-term holding perspective, it is not that great, but that is one of the reasons why our approach is so useful. It serves as a hedge when action takes a turn for the worse, limiting our downside on any overarching bearish moves, while also serving to double up the profit we draw as price runs to the upside.
So, with this noted, and as we head into the session today, here is a look at how we are going to apply this framework to any volatility in the bitcoin price and where we are looking to get in and out of the markets according to the rules of our strategy.
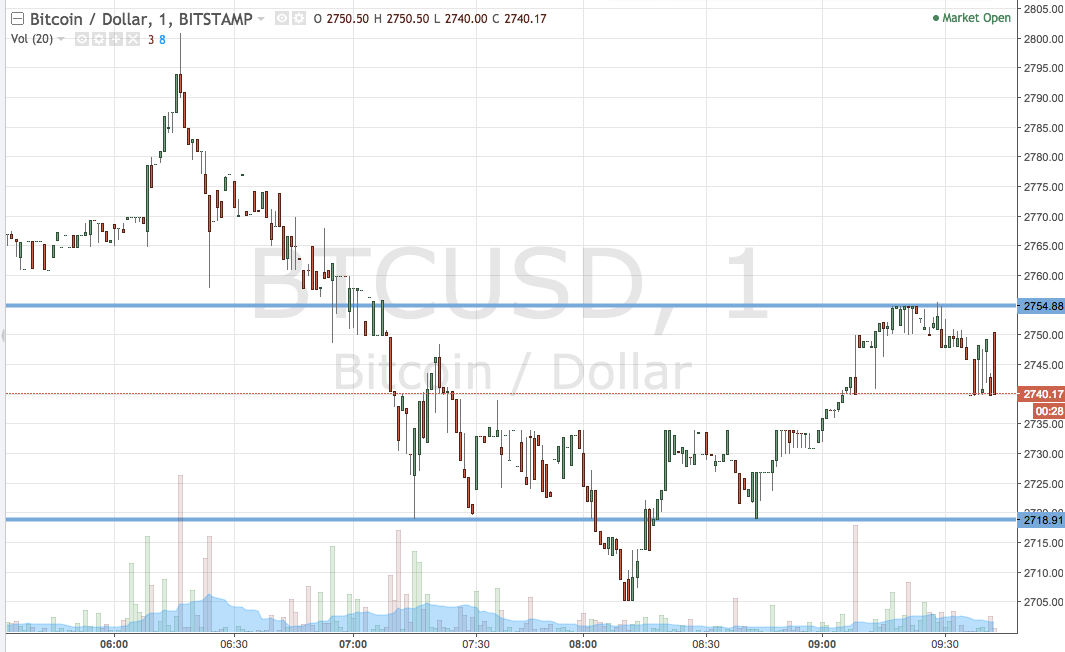
As ever, get a quick look at the chart below before we get started. It is a one-minute candlestick chart and it has our range overlaid in blue.

As the chart shows, the range we are using for today’s session comes in as defined by support to the downside at 2718 and resistance to the upside at 2754. If we see a close above the latter, we will enter long towards an upside target of 2775. Conversely, a close below the formal part is in short towards 2700 flat.
Charts courtesy of Trading View
SaveSave


