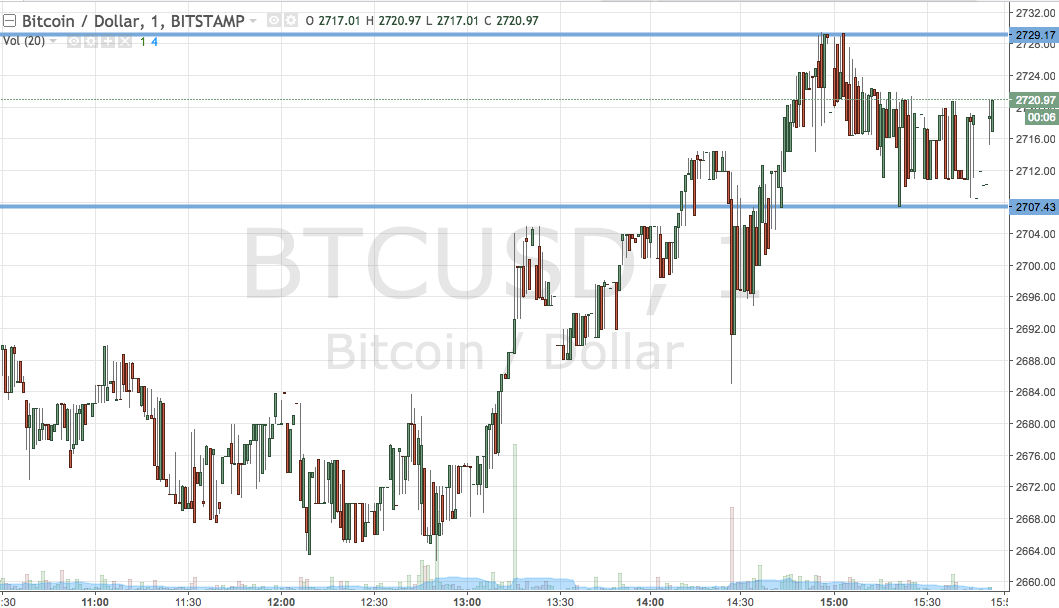
We have come to the end of the day in another of our bitcoin price trading sessions out of Europe and the upside trend we highlighted this morning as potentially being indicative of a long-term reversal of the correction, and by proxy, a return to the overarching upside momentum, looks to have continued throughout the session. Price currently trades in and around 2720, a level that we were watching pretty closely (well, we were watching 2700 flat closely, but the break activated current levels as being ones to watch), and after a short period of consolidation late this afternoon, we could well be in for a break to the upside and – in turn – a nice run that we can use to take advantage of the volatility.
So, without wasting any time, let’s put some key levels together and a framework that can underpin our strategy for tonight, with a look at our entry point, stop losses and targets on each potential position signal.
As ever, take a quick look at the chart below before we get started. It is a one-minute candlestick chart and it has our key range overlaid in blue.

As highlighted by the chart this evening, then, we have a range that comes in as defined by support to the downside at 2707 and resistance to the upside at 2729. Readers may recognize that this pretty much straddles current levels (the above-mentioned 2720) evenly, meaning we don’t really have an overarching bias right now (although we would love an upside break, we will be happy to get into a short side trade if that is what price implies).
If we see a break of resistance, we will enter long towards an upside target of 2750. A stop loss on the trade at 2720 works well. Looking the other way, a close below support will signal entry towards 2690, while a stop loss, again, at 2720, defines risk.
Child’s courtesy of Trading View


