Reason to trust

How Our News is Made
Strict editorial policy that focuses on accuracy, relevance, and impartiality
Ad discliamer
Morbi pretium leo et nisl aliquam mollis. Quisque arcu lorem, ultricies quis pellentesque nec, ullamcorper eu odio.
It is Wednesday morning, and time to publish the first of our twice daily bitcoin price watch analyses. In yesterday evening’s coverage, we noted that price had been pretty volatile during the day and that this warranted a relatively tight range for the late session. We set up against price with some equally tight stop losses and looking for what we expected to be a pretty choppy session. As it turns out, things were a little bit smoother than we expected. Not that we didn’t get any volatility – we saw a spike to the downside around the session close out of the US – but after that, things seemed to settle down and we saw some sideways trading. Sideways trading can be great as far as setting a range is concerned and it is this premise with which we are going to run today.
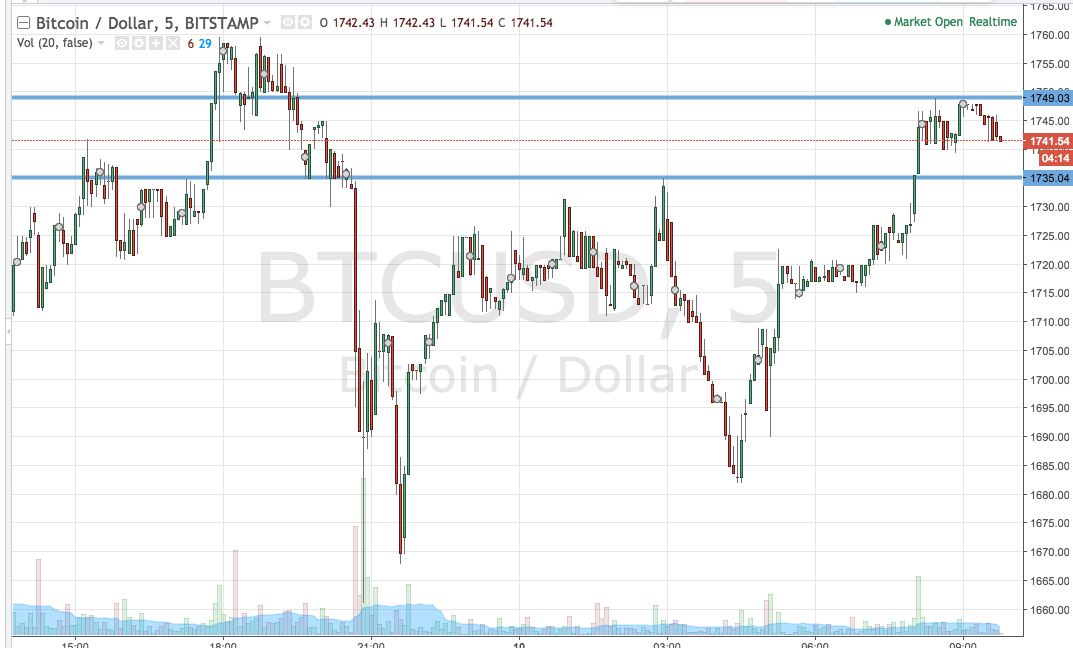
So, let’s outline some key levels for the session this morning, and see if we can draw profit from the market on any forward volatility. As ever, take a quick look at the chart below before we get started in order to get an idea of what’s on, and where we are looking to get in and out of the markets according to the rules of our intraday strategy. It is a five-minute candlestick chart, and it has our key range overlaid in green.

As the chart shows, the range we are looking at is defined by support to the downside at 1735 and resistance to the upside at 1749. Breakout only for the early session.
Specifically, then, we will enter long on a close above resistance towards an immediate upside target of 1760. Conversely, a close below support will get us in short towards 1725. Stop losses on both positions just the other side of the entries will ensure that we are taken out of the trade in the event of a bias reversal.
Chart courtesy of Trading View


