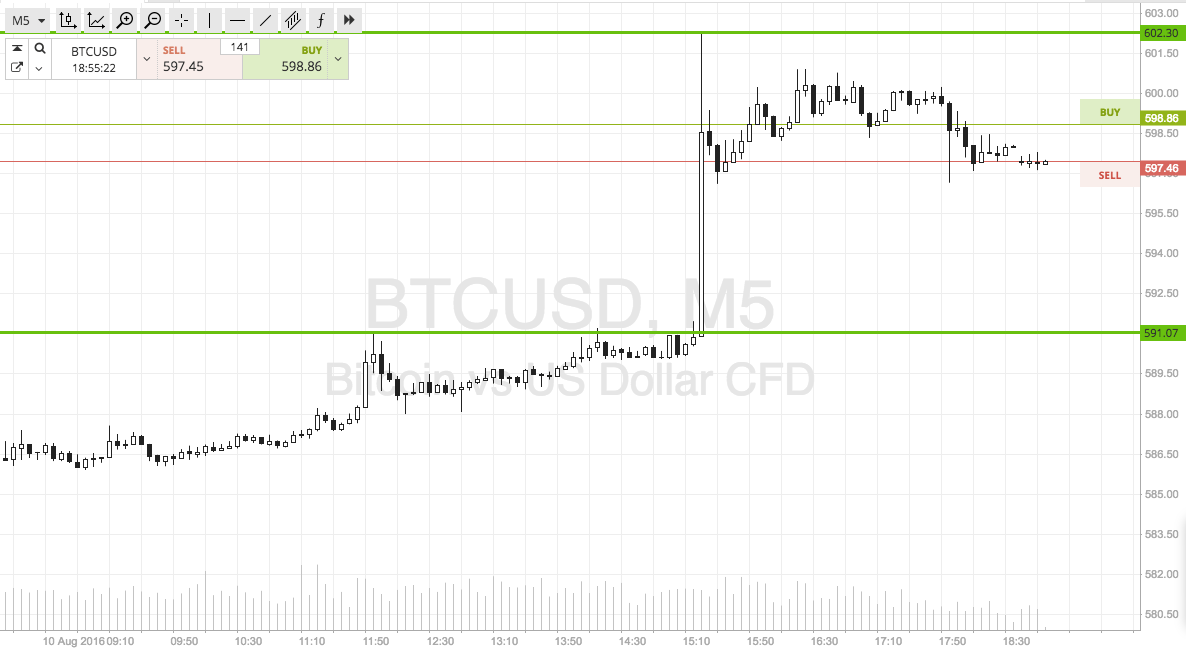
In this morning’s bitcoin price watch piece, we discussed the fact that action to date this week has been relatively flat, and that we were hoping to get a breakout that we could get in and out on a quick short term scalp entry and draw a profit from the market on the volatility. Action has not been bad today, and we’ve had a relatively decent European session. We didn’t manage to get multiple positions entered, but we did get a nice quick trade to the upside, and managed to draw a profit in the process. Price broke the 600 flat level for the first time in a while, which gives us an immediate longer term upside bullish bias, but from a short-term perspective, and as we head into this evening’s session out of Asia (and the close of the US session shortly) let’s take a look at the markets and see what we can do with today’s action. As ever, take a quick look at the chart below to get an idea of the levels in focus. It’s a five-minute candlestick chart with the key levels overlaid in green.

As the chart shows, we’re looking at support to the downside at 591, and resistance to the upside at 602. Bear in mind that with 600 being a key psychological level, there could be some friction towards resistance, but we will take this into consideration ahead of any entries. We’re going to focus primarily on a breakout strategy, so if price breaks and closes above resistance, we will look to enter long towards 610. A stop loss on this one somewhere in the region of 599 defines risk nicely.
Looking the other way, if price closes below support, we will enter short towards an immediate downside target of 582. Again we need a stop loss on the trade, and somewhere in the region of 594 looks good
Charts courtesy of SimpleFX


