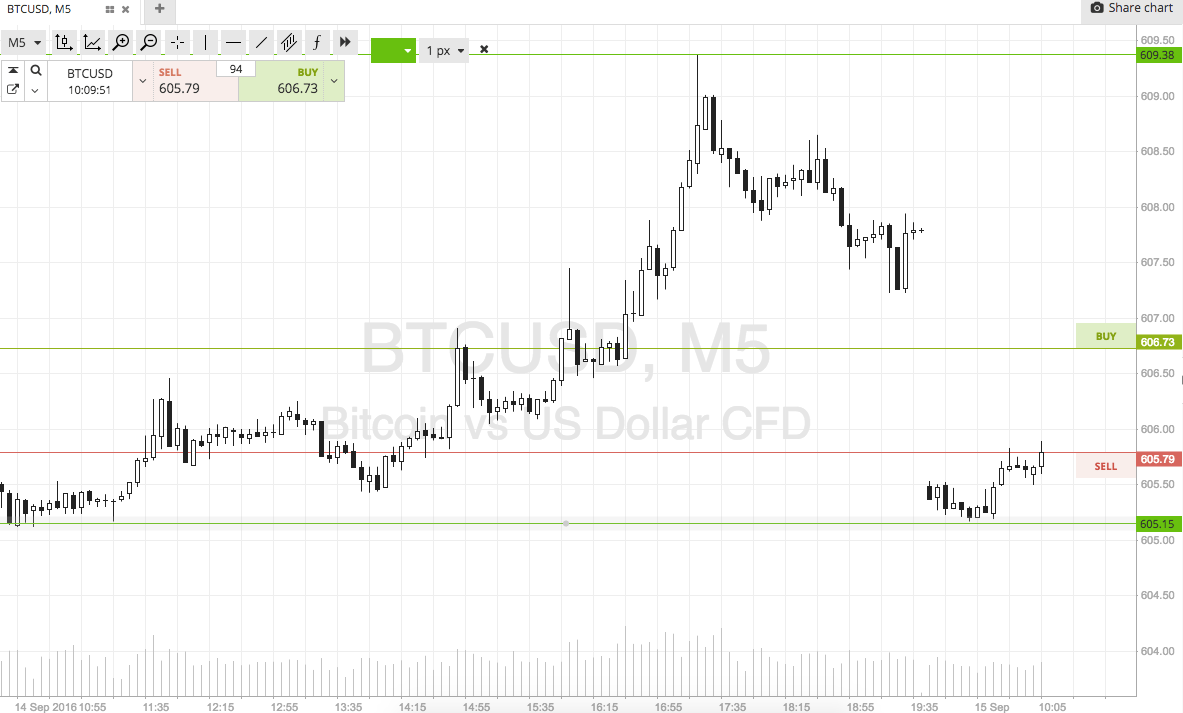
So it’s Thursday morning, and time to take a look at the bitcoin price for the first time this morning – pre European session. Things have been pretty active this week, and we’ve managed to get in and out of the markets according to our intraday strategy on more than one occasion. We are net up on the market, and we’d like to carry tis positive bias through to the end of tomorrow’s session and close out another big week.
Action overnight was pretty interesting.
Price gained to reach the level we had pre-slated as in term resistance to the upside, but failed to break, and quickly gapped down towards our predefined in term support level. What does this tell us?
That there is plenty of volume surrounding these regions, and that they should hold firm as we look to carry them forward into the European session this morning.
So, with this in mind, and as we head into a fresh session, let’s take a look at what we are going after today.
As ever, take a quick look at the chart below to get an idea of what’s on, and where we are targeting an entry and an exit on any volatility. The chart is an intraday five-minute chart with our range overlaid in green. It also shows the gap down that we discussed a little earlier.

So, as the chart shows, the range we are focusing on is defined by in term support to the downside at 605 flat, and resistance to the upside at 610.
This is a tight range, so breakout only.
Specifically, if we see price close above resistance, we will look to get in long towards an immediate upside target of 615. A close below support will put us short towards 600 flat. Stops just the other side of the entries on both positions will keep our risk tight.
Charts courtesy of SimpleFX


