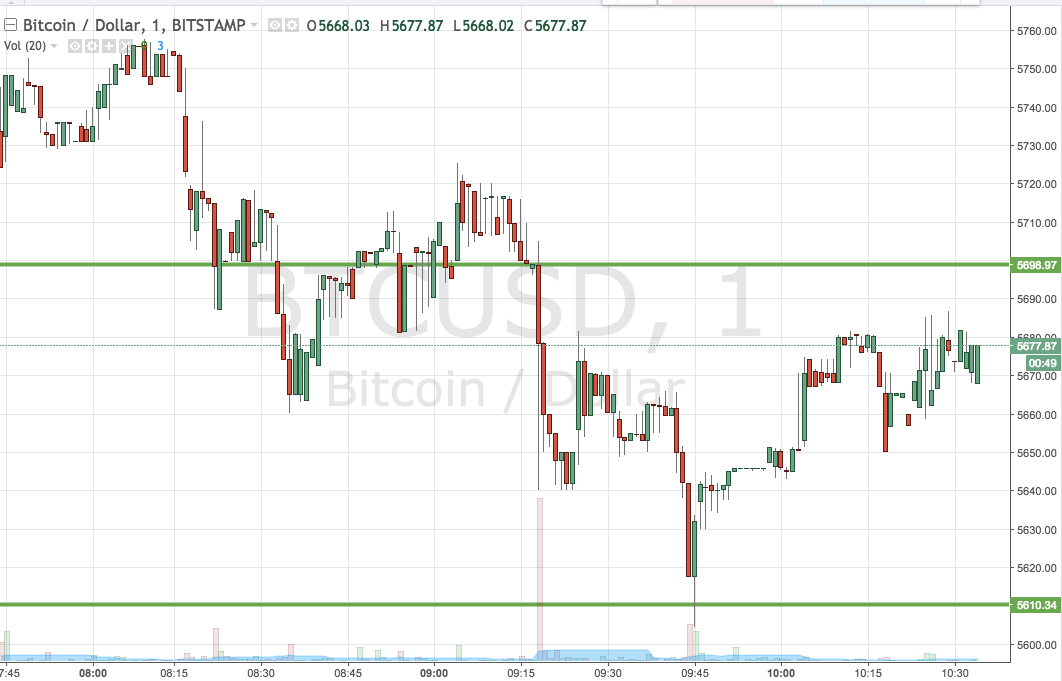
Things moved pretty fast overnight in the bitcoin price and we’ve seen the market take a bit of a hit on the late US volume. Price is currently trading in and around the 5670 level, which is a little down on the levels we were looking at heading into the crossover session last night, and how long this dip will last remains to be seen.
If the action that we got over the weekend and into this fresh week is anything to go by, however, we aren’t expecting too much weakness near term.
Price is consolidating a little bit and it’s not going to take much to get things turned around and to get price moving back northwards, so long as the bulls can regain control of the market before we hit any key psychologically significant levels (say, for example, 5,500).
So, with this noted, let’s get some levels in place that we can use to push forward into the session this morning n an attempt to draw a profit from the market. As ever, take a quick look at the chart below before we get started so as to get an idea where things stand and where we are looking to get in and out of the markets if we see any volatility. It’s a one minute candlestick chart and it’s got our key range overlaid in green.

As the chart shows, the range we’ve got in our sights for the session this morning comes in as defined by support to the downside at 5610 and resistance to the upside at 5698. If we see a close above resistance, we’ll jump into the markets for a long entry towards an immediate upside target of 5740. Conversely, a close below support will get us in short towards a target of 5570.
Let’s see how things play out.
Charts courtesy of Trading View


