It seems as though, despite our much discussed intraday fluctuations, the bitcoin price has stabilized somewhat over the past few weeks. At least, that is, on the wider time frames. The 640-67- range seems to be pretty restrictive, and price hasn’t really managed to break through these levels for anything sustained for a while. Why this is, it’s tough to tell. Fundamentally, the industry is very much active, and we see developments on a regular basis. In all honesty, its probably a sign that the industry is maturing. Why are we discussing this? Well, it has implications for our intraday operations. Things are a little flat, and when this happens, we are able to go at price with an intrarange approach in order to maximize our chances of picking up a profitable exposure.
We are about to head into a fresh European session this morning, and action overnight, while not particularly volatile on the wider timeframes, looks a bit up and down on the intraday – specifically the 5-minute chart. Price declined into the small hours of the morning in Europe, and then found support before correcting and reversing to the upside to where we currently trade. This action gives us a nice definition on today’s parameters (recent swing high, recent swing low) and so we should see some nice signals.
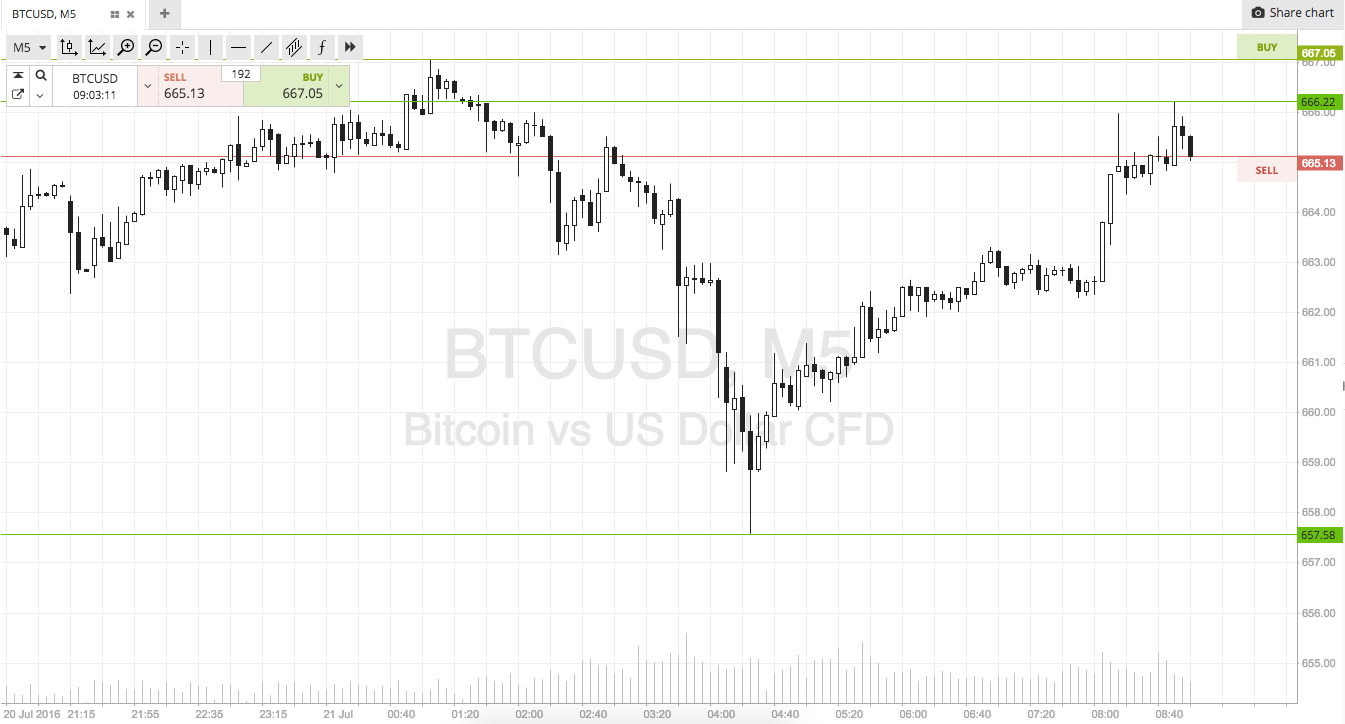
With this in mind, and as we head into today’s session, here’s a look at what we are focusing on going forward. Take a look at the chart to get an idea of our range.

As the chart shows, we are looking at in term support at 657, and in term resistance comes in at 666 flat.
If price corrects from resistance, we will look to enter short towards an initial downside target of support. Stop loss at 669 to define risk. The opposite works for a bounce from support.
Charts courtesy of Trading View


