In our bitcoin price analysis this morning, we noted that the overarching momentum was to the upside, but that we may see a correction near term as the shorter-term traders pulled profits off the table and booked gains on the longer-term action. At that point, we were trading a little above the $1700 mark, having corrected over the weekend somewhat and then bounced up to a return to the bullish action through the early week sessions. As it turns out, that is pretty much exactly what we have seen today. Price has corrected a little bit but maintained much of the strength picked up on the longer term charts and given us a bit of sideways action for the session. Not that there is anything wrong with sideways action. Sometimes it can be good to get some key levels outlined using this type of momentum, and that is what we are going to do for this evening’s session.
So, let’s get to the detail.
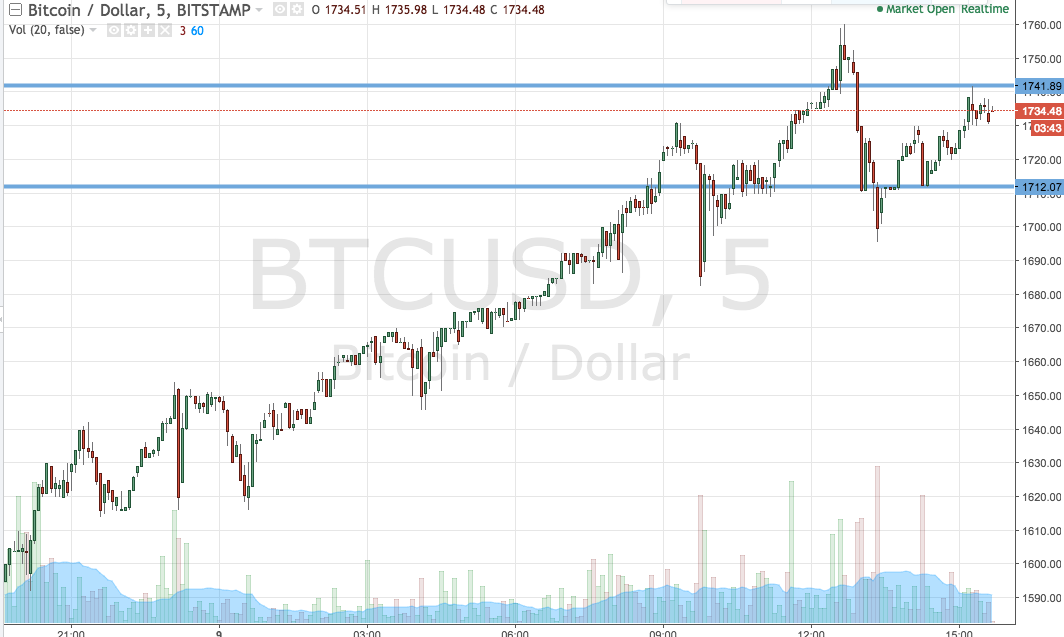
As ever, take a quick look at the chart below to get an idea of what is on. It is a five-minute candlestick chart and it has our key range overlaid in green.

As the chart shows, the range we are looking at for this evening is defined by support to the downside at 1712 and resistance to the upside at 1742. Breakout only for now.
So, if we see price break above resistance, we will enter long towards an immediate upside target of 1755. A stop loss on the trade at 1736 works to keep our risk limited and will ensure we are taken out of the position in the event of a bias reversal. Conversely, and looking short, if we see price close below support, we will enter long towards 1700 flat. A stop at 1717 keeps risk tight on this latter position.
Let’s see what happens.
Chart courtesy of Trading View


