Well that’s another day done for our bitcoin price trading, and it’s been a pretty interesting one. Yet again, things have been earth shattering in terms of movement, but that hasn’t stopped us from getting in and out of the markets according to the rules of out intraday strategy – quite the opposite. We managed to get in earlier this morning on a quick turnaround breakout entry, and then again once price retraced a little bit on a second entry play.
We’re now trading pretty close to 1,100, a level that we’ve had in the back of our minds (although not directly as a near term target, more of something to keep an eye on) for a while now, and with any luck, we’ll see it come in to play officially a little later on this evening.
For now, though, let’s focus on what’s directly in front of us.
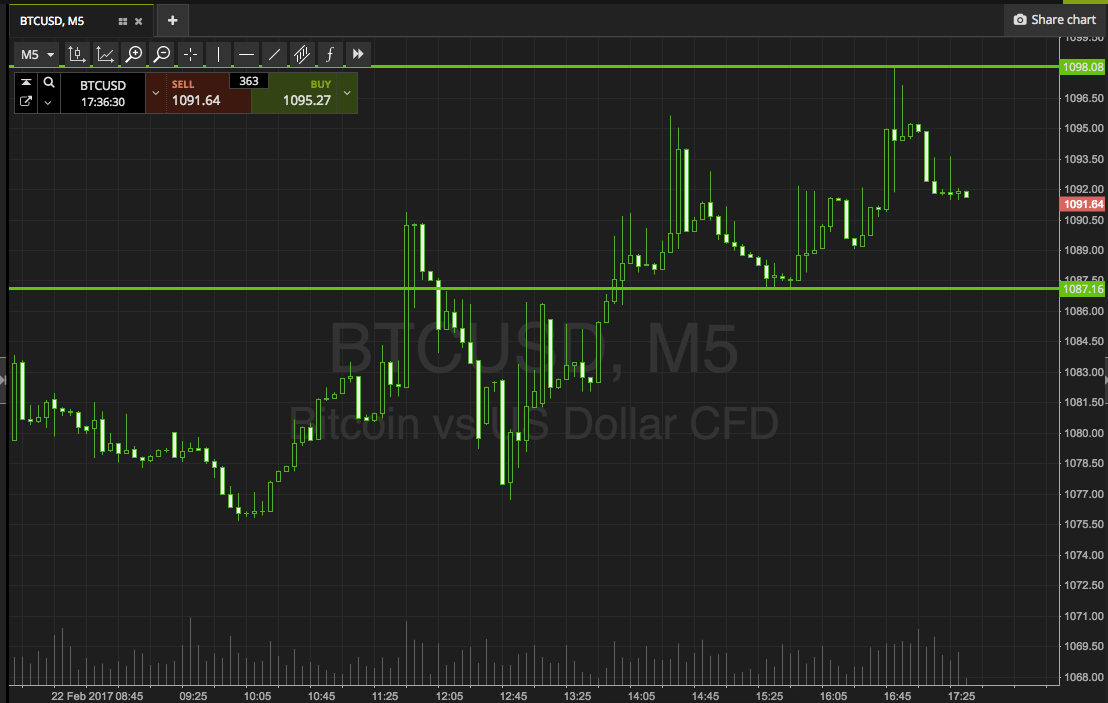
As ever, take a quick look at the chart below to get an idea of where things stand, and where we are looking to get in and out of the markets according to the rules of our intraday strategy. It’s a five-minute candlestick chart, and it’s got our range overlaid in green.

As the chart shows, the range we are looking at right now is defined to the downside by support at 1087 flat, and to the upside by resistance at 1098. We’re not going all the way to 1100 on this one, as we’ve got to stick with the most recent highs as our outer limit.
So, if we see price break though resistance, we’ll get in long towards 1110. Conversely, a close below support will signal short towards an immediate downside target of 1080. That one’s a little tighter.
A stop loss on both positions somewhere around a few dollars the other side of the entry will take us out of the trade if price reverses against us.
Charts courtesy of SimpleFX


