So that’s another week drawn to a conclusion in the bitcoin price space and, with it, it’s time to put forward some levels that we can use heading into the weekend as part of our second bitcoin price analysis of the day.
By now most reading will be aware what happened yesterday. For those that missed the action, the bitcoin price rocketed to just shy of $20,000 a piece on the major exchanges, with speculation as to how the introduction of bitcoin futures into the market (which is slated to happen on Sunday) likely driving the push.
Subsequent to the run, however, things turned around pretty quickly and price fell back to in and around the $15,000 mark, which is where things sit as we head into the session this evening.
With any luck, this correction will be short lived.
If it’s not, we’re good to hedge action going into the late session tonight.
So, with all that said, let’s get some levels in place that we can use to try and draw a profit from the market as and when things move.
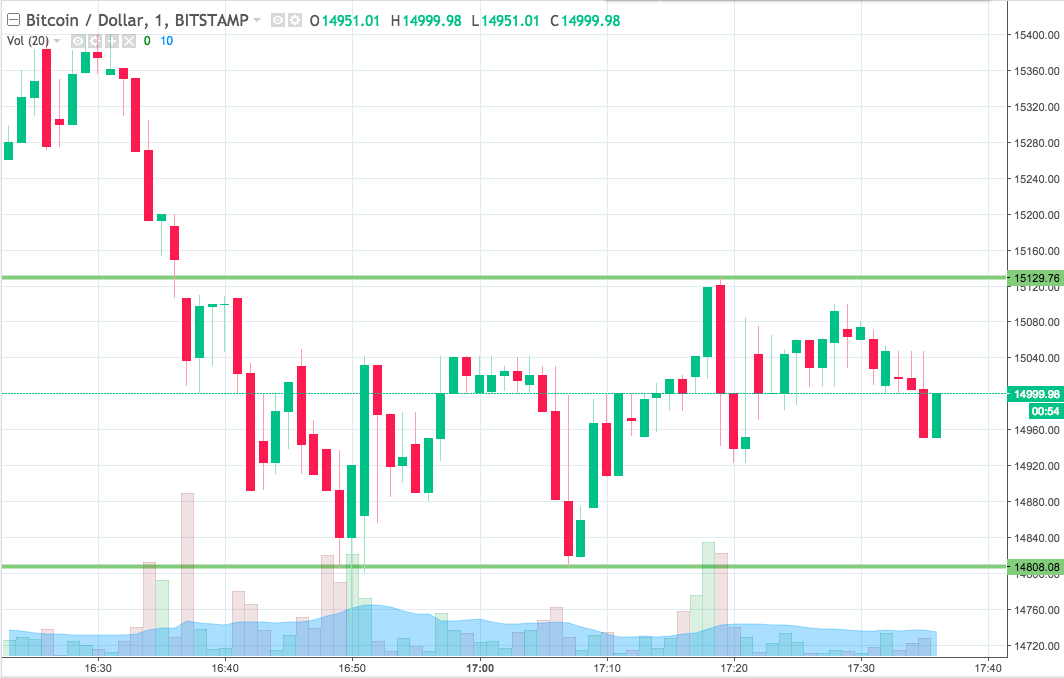
Before we get started, take a quick look at the chart below. It’s a one-minute candlestick chart and it’s got our primary range overlaid in green.
 Here’s what we’re looking at in the bitcoin price this evening and where we intend to jump in and out of the markets on any volatility.
As the chart shows, the range we are using for the session this evening comes in as defined by support to the downside at 14808 and resistance to the upside at 15129. We are going to look at getting in long on a close above resistance if we see price break above that level. On the trade, a target of 15200 looks good.
Looking the other way, if we see price close below support, we’ll jump in short towards a downside target of 14750.
Let’s see what happens over the weekend.
Happy trading!
Charts courtesy of Trading View


