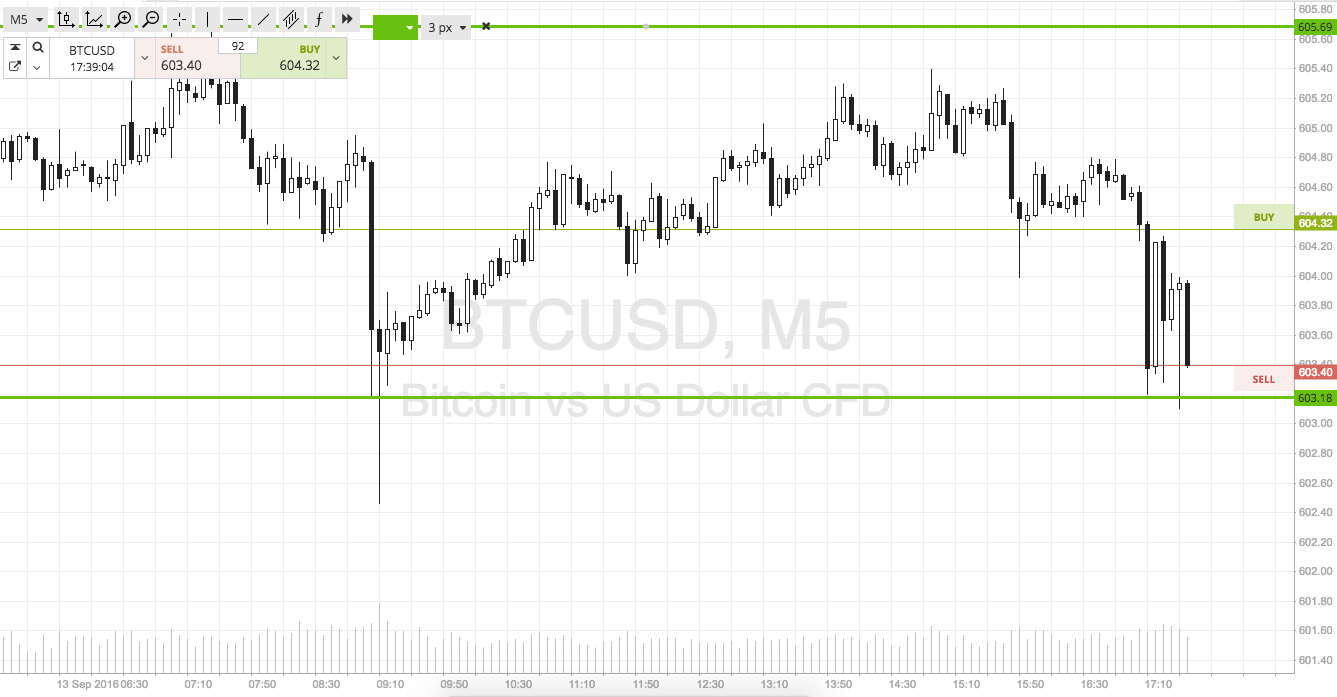
Well that’s it, another day down. The crux of this morning’s article was the head and shoulders pattern that we saw as indicative of a bearish bias for the European morning session. Action has now matured, and we didn’t see the momentum we expected – at least not yet. The range we outlined was defined by the upper limit of the pattern (the head) and the lower limit of the pattern (the neckline; the point at which a breaking would complete the pattern and active entry).
Today we’ve seen a run up towards the former, and then a decline towards (and a testing of, on more than one occasion) the latter. Since we remain within grange, and we’ve seen an unsuccessful break attempt on support, we are going to invalidate the pattern but hold our range in place for this evening’s session.
So, let’s get going on the details.
As ever, take a quick look at the chart below to get an idea what’s on, and where we are looking to get in and out of the markets according to our intraday strategy this evening. The chart is a 5-minute candlestick (quickly becoming our go-to timeframe) with our predefined range overlaid in green.

As the chart shows, the range in focus for this evening is defined by in term support to the downside at 603 flat and in term resistance to the upside at 606.
We are currently trading just ahead of support, so let’s address the downside potential first.
Specifically, if price breaks through in term support we are going to look at entering short towards an immediate bearish target of 597 flat. A stop on the trade at 605 defines risk.
Conversely, a close above resistance will put us long towards 610 to the upside. Again we need a stop, and somewhere in the region of 604 looks good.
Happy Trading!
Charts courtesy of SimpleFX


