Reason to trust

How Our News is Made
Strict editorial policy that focuses on accuracy, relevance, and impartiality
Ad discliamer
Morbi pretium leo et nisl aliquam mollis. Quisque arcu lorem, ultricies quis pellentesque nec, ullamcorper eu odio.
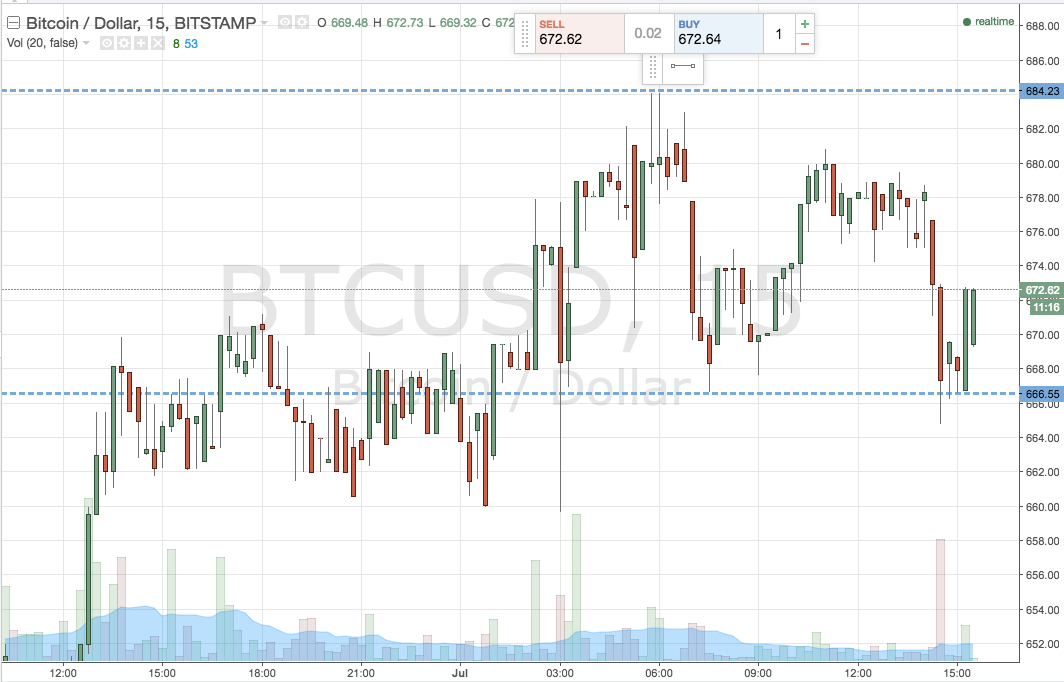
The week has now drawn to a close, and it is time to publish our final analysis. Action throughout this week has been pretty interesting, and we have managed to get in and out of the markets on a number of occasions both long and short. Price today, unfortunately, has not been quite as volatile, and we haven’t really been able to do that much from a position setting perspective. This doesn’t mean we won’t see some volatility this weekend, however, so, as we head into this evening’s session and the Asian open in the morning tomorrow, here is a look at what we are focusing on. First up, take a quick look at the chart below to get an idea of our range in focus. As ever, the candlestick chart you are looking at is a 15 minute chart showing the last 24 hours worth of action, and it has both our range and a couple of key targets overlaid for illustrative purposes.

As the chart shows, action today has remained well within our predefined range, but we did get an intrarange long entry about half an hour ago. We remain in this trade (long from support targeting resistance), but with it being intrarange, it won’t stop was getting into any breakout trades this evening. The range we are looking at remains defined by support to the downside at 666, and resistance to the upside at 684. There is no need to alter these levels given today’s action. To reiterate that we said this morning, if price breaks above resistance we will enter long towards an upside target of 700. A stop loss on the trade somewhere in the region of 680 defines risk. Conversely, a break and a close below support signals short towards a slightly more aggressive downside target of 650. Again we need a stop loss, and somewhere in the region of 670 looks good.
Charts courtesy of Trading View


