Reason to trust
How Our News is Made
Strict editorial policy that focuses on accuracy, relevance, and impartiality
Ad discliamer
Morbi pretium leo et nisl aliquam mollis. Quisque arcu lorem, ultricies quis pellentesque nec, ullamcorper eu odio.
Last week was a pretty good week for our intraday, bitcoin price strategy. We managed to get in and out of some decent trades, and limited our downside to just a few, negligible chop outs. With any luck, we’re in for a similar week this time around. If action over the weekend is anything to go by, then we can expect some volatility, and in turn, some entry signals. There haven’t really been any major fundamental developments, so our strategy heading in to today’s session will be primarily technically driven.
With this said, let’s take a look at the key levels for today’s session, and try and slate some potential setups. As always, get a quick look at the chart below to get an idea of what happened over the last couple of days, and what’s on today. It’s a 15 minute, intraday candlestick chart representing the last circa 48 hours’ worth of action in the bitcoin price.
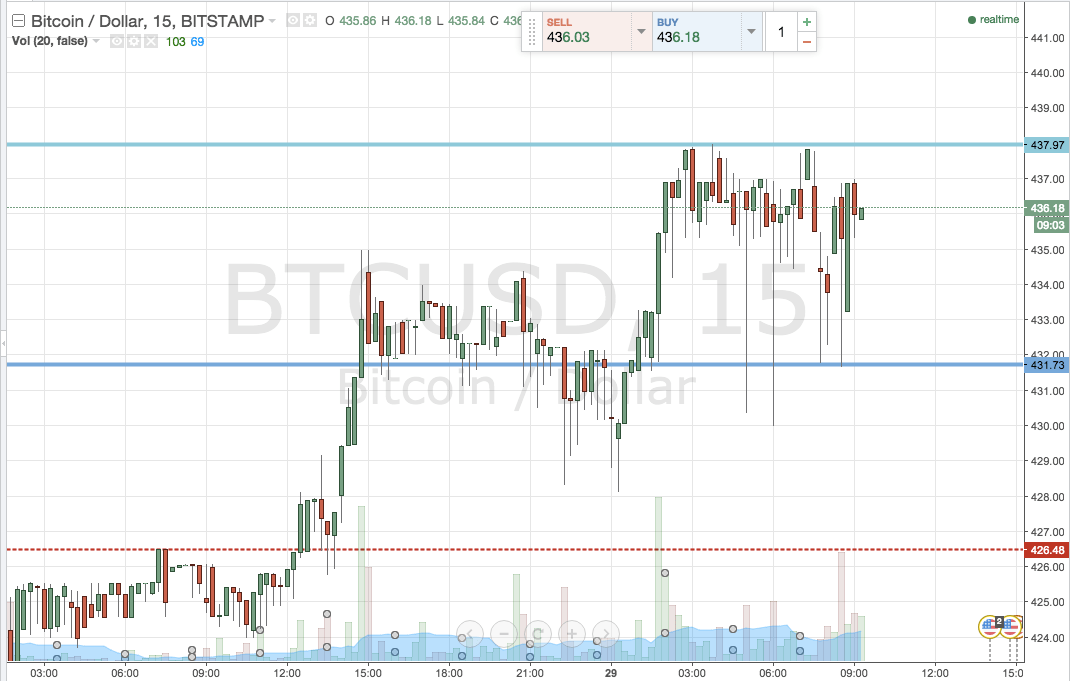
As you can see from the chart, the last couple of hours have been pretty up and down, with some spikes and some gaps, and we’ve been able to use this action to define a pretty solid range. In term support comes in at 431.73, while resistance sits at 438 flat to the upside.
Intrarange is on, so for those looking to get in on the sideways action, long on a bounce form support, stop just below, and short on a correction from resistance, stop just above. Both trades target the opposite levels.
From a breakout perspective, a close below in term support will put us short towards an immediate downside target of 426.5. A stop on this one around 433 defines the trade’s risk.
Looking long, a close above 438 flat will signal a bullish position towards 442. Again, a stop somewhere in the region of 436 keeps things tight from a risk management perspective.
Charts courtesy of Trading View