Ok so things were a little more volatile over the weekend than we initially expected them to be. When we closed out the session last Friday, Price was hovering in and around the 1130 mark, and we expected 1100 to hold over the weekend as longer-term support. This, unfortunately, did not happen. The bitcoin price currently trades in and around the mid-1130s, and we have had to adjust our long-term support expectations based on this action. It doesn’t really change anything from a strategy perspective – we’re still going to look to get in both long and short as and when price dictates – but it does open up the potential for a little bit more aggression to the downside than we were willing to take on previously.
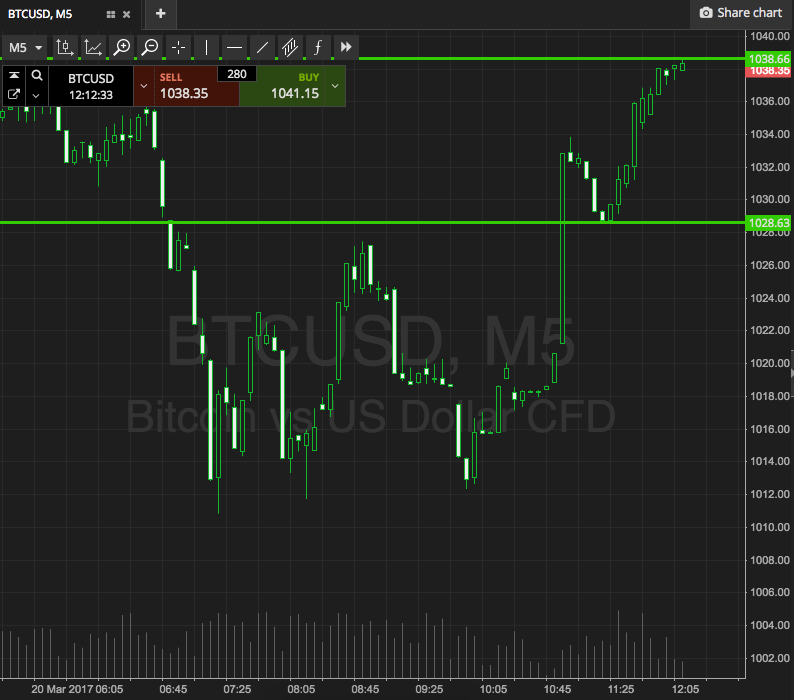
Anyway, let’s get to the detail, and outline some key levels with which we can move forward today. Take a look at the chart below before we get started to get an idea of what is on, and where things stand right now.

As the chart shows, the range we’re looking at is defined by support to the downside 1028, and resistance to the upside at 1038. With about $10 worth of range, intrarange is an option, so long at support and short at resistance, targeting the opposing levels. A stop loss just the other side of the entries will ensure we are taken out of the positions for only a small loss in the event of a bias reversal.
Looking at our breakout strategy, if price closes above resistance, we will enter long towards an immediate upside target of 1048. A stop loss on this one at 1035 defines risk. Conversely, a close below support will put us in short towards 1015. On this one, a stop loss at 1032 looks to work well.
Let’s see how things play out.
Charts courtesy of SimpleFX


