So that is another week done for our bitcoin price trading efforts, and it has been a pretty interesting one. Price ran-up throughout the majority of the last few days, logging fresh highs as it went, and drawing plenty of speculative volume along the way. This speculative volume fed its own fire, and a self-fulfilling cycle pushed the bitcoin price up further. We knew we were due a correction, and when we got a small correction overnight on Wednesday, it looked as though that might be all we would see as far as the near term sell side was concerned. As it happens, it wasn’t. Price corrected overnight on Thursday as well and broke down through the 1700 mark pretty severely. It was only a spike, but it was representative of quite a large portion of traders taking profits off the table, and these sorts of corrections can take a little bit to recover.
We did see a slight recovery, and price is currently trading just shy of 1800 again, but whether we are going to see a break of this level before the weekend is anybody’s guess.
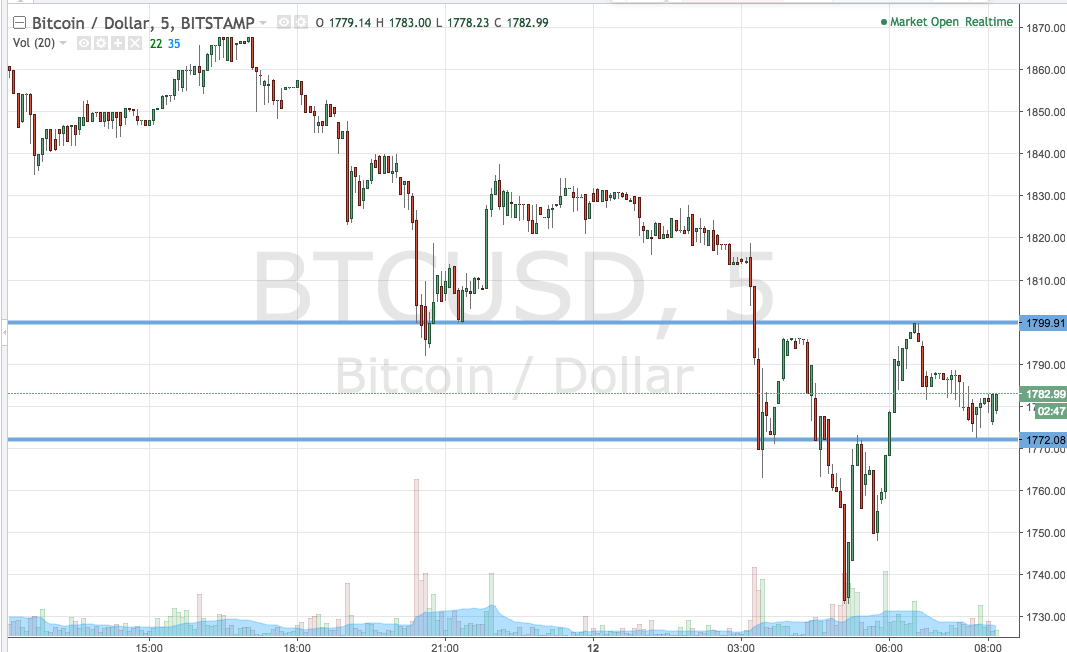
Anyway, all we can do is set up against price and try and draw a profit from the market on any short-term volatility. As ever, take a quick look at the chart below to get an idea of what is on. It is a five-minute candlestick chart, and it has our key range overlaid in green.

As the chart shows, the range in question is defined by support to the downside at 1772 and resistance to the upside at 1799. If we see price break above resistance, we are going to look for a close above that level to get us into a long trade towards an immediate upside target of 1850. A stop loss on the trade at 1795 works well. Looking the other way, a close below support will get us into a short entry towards a downside target of 1765. This one’s a pretty tight trade, so we need a tight stop loss. Somewhere in the region of 1775 looks good.
Charts courtesy of Trading View


