Our start to the week was a great one, and our end to last week was even better, but now it looks as though things might be starting to slow down a touch. Action during today’s European session has been pretty flat, and we’ve not managed to get in and out of the markets as we might have liked. This doesn’t mean that we won’t be able to get in this evening, of course. Things are often quiet during the European session before popping in to action overnight and – as the US session and (with a short gap) the Asian session combine – volume picks up and gives us something to go at.
It’s this something that we are targeting now, and so with any luck we will be hitting the screens tomorrow with a couple of nice profits under our belts.
So, with this in mind, and as we head into the evening session tonight, let’s take a look at what’s going on in the bitcoin price markets, and see where we can aim to get in and out of the market according to our intraday strategy as action allows.
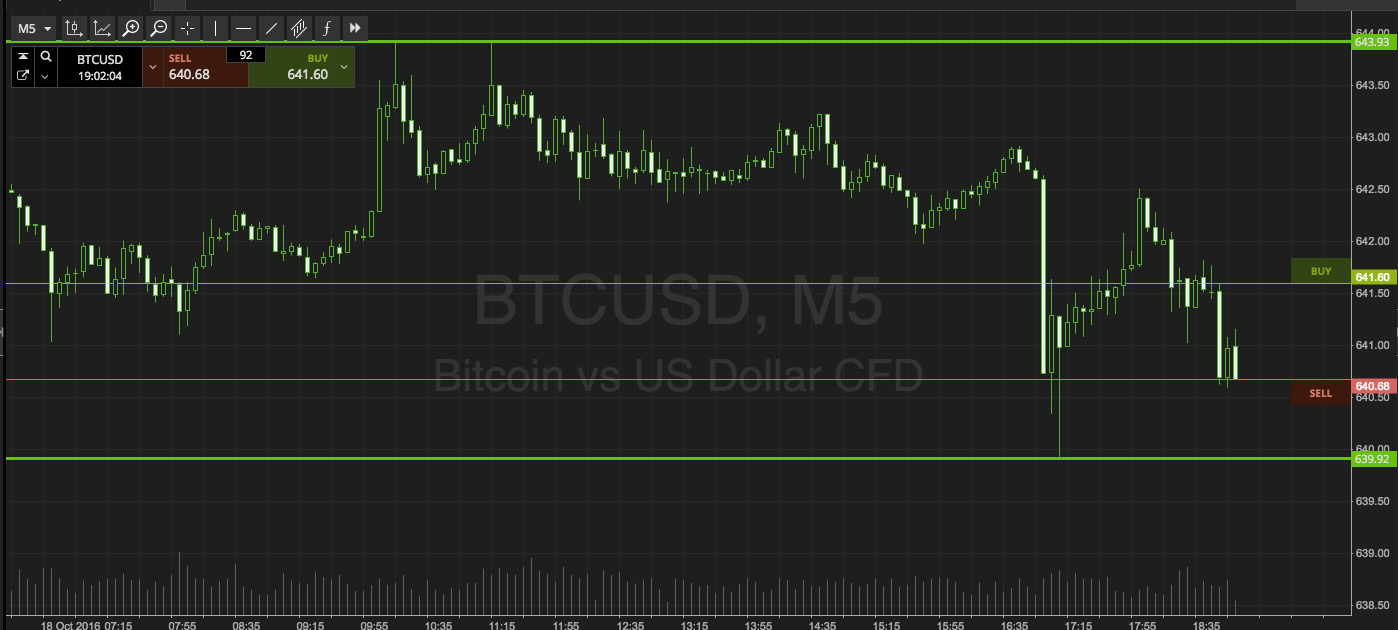
Let’s kick things off with a chart. The chart below is our five-minute candlestick chart (note we have stuck with the black background!) and it shows today’s action. It also shows the evening’s range for tonight.

As the chart shows, the range in focus is defined by in term support to the downside at 639, and in term resistance to the upside at 644. It’s pretty much the same range we’ve been looking at today, with a slightly altered support.
So, if we see price break above resistance, we are going to look to get in long towards an immediate upside target of 650 flat. Conversely, a close below resistance will put us short towards 635.
Happy Trading!
Charts courtesy of SimpleFX


