So we are at the end of the week once again in our bitcoin price trading efforts and, instead of spending too much time going over what happened this week, we’re going to jump straight into the detail for today’s session. Price is trading in and around a key level and if we waste time covering overnight action there is a good chance that we might miss an entry and – by proxy – the opportunity to draw a profit from the market ahead of the European open.
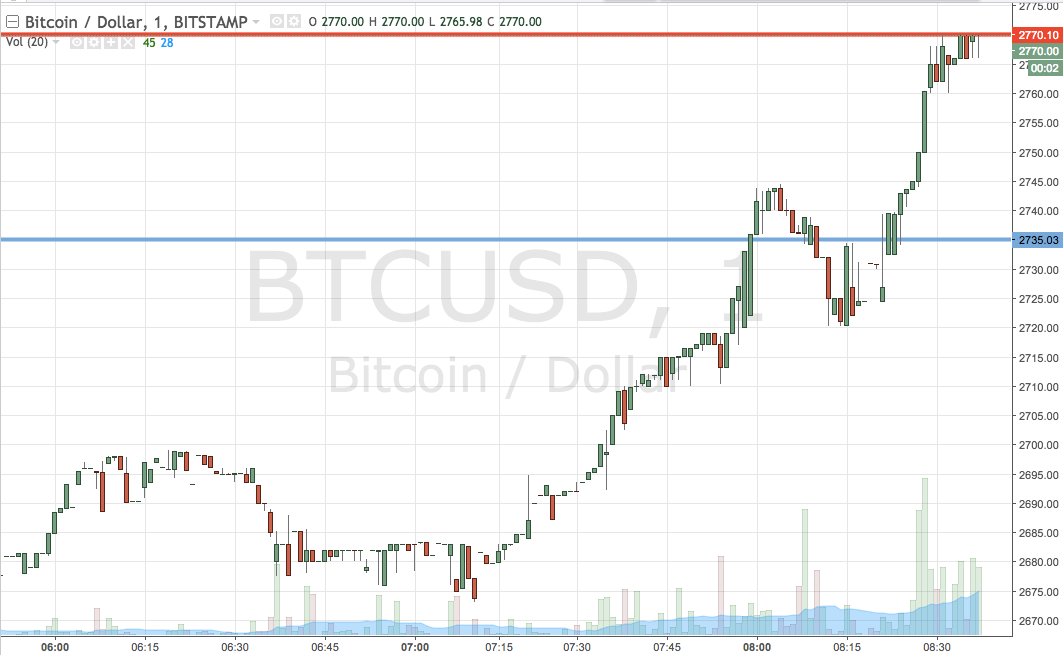
So, as ever, take a quick look at the chart below before we get started so as to get an idea of what’s on and where things stand right now.
It is a one-minute candlestick chart and it has our key range overlaid in blue (support) and red (resistance).

As the chart shows, the range that we are looking at for the session today comes in as defined by support to the downside at 2735 and resistance to the upside at 2770. We are going to stick with our standard breakout approach for the time being, purely because price has been subject to a number of sustained momentum runs over the last few days and – with any luck – we will see a continuation of this sort of momentum as we head into the weekend.
So, our first trade comes from a close above resistance, on which we will enter long towards an immediate upside target of 2800 flat. A stop loss on the position somewhere in the region of 2760 gives us plenty of room to avoid a chop out while also ensuring that we are taken out of the position in the event that price turns around and starts to trade against us.
Looking the other way, if price breaks below support, we will look for a close below that level to get us in short towards a downside target of 2700 flat. On this one, a stop loss at 2745 works well to define risk.
Charts courtesy of Trading View


