It’s Tuesday morning and it’s time to take a look at how action in the bitcoin price played overnight and – in turn – try to figure out how we can incorporate said action into a forward strategy today. Normally we spend a bit of time on some backdated analysis but, during the early session, things are moving incredibly fast. As such, if we take up too much time we might miss an entry.
So, with this in mind, let’s get things moving right away.
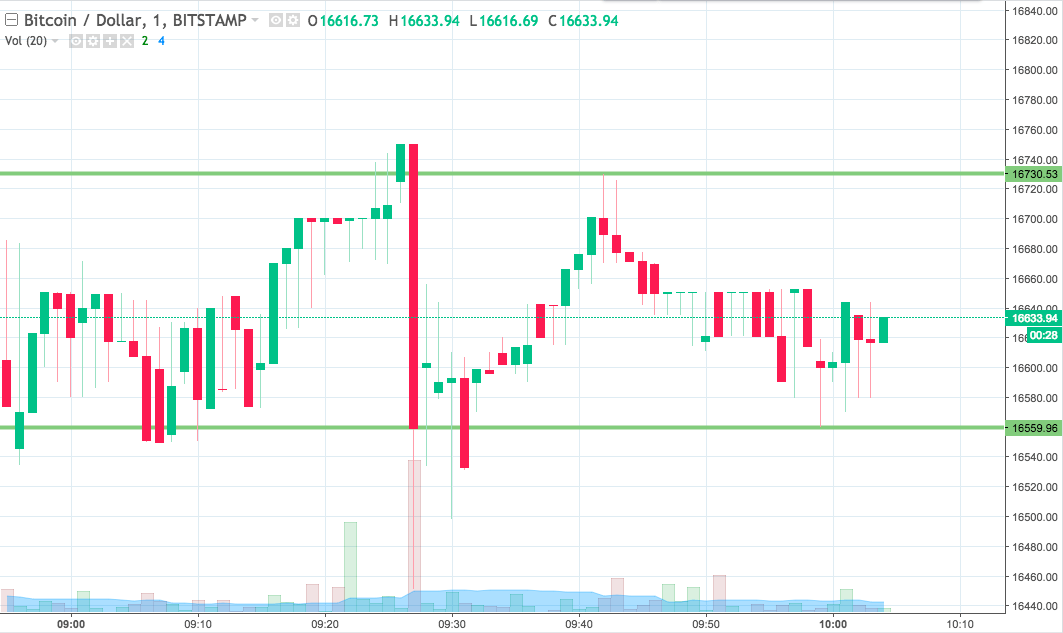
As ever, take a quick look at the chart below before we get started so as to get an idea where things stand and where we are looking to jump in and out of the markets according to the rules of our intraday strategy. The chart is a one-minute candlestick chart and it’s got our key range overlaid in green.

As the chart shows, the range we are using for the session today comes in as defined by support to the downside at 16559 and resistance to the upside at 16730.
We are going to stick with our standard breakout strategy for the time being, purely because that’s the best sort of approach when we are facing consolidation type action (as we are at the moment) and, in turn, when we expect that the tight range we have outlined will break near term.
So, with that said, if we see price break above resistance, we’ll be jumping in long towards an immediate upside target of 16800. A stop loss on the position somewhere in the region of 16700 will take us out of the trade if things turn against us.
Looking the other way, if we see price close below support, we will jump in short towards a downside target of 16500.
Let’s see how things play out.
Charts courtesy of Trading View


