So let’s get things going for the penultimate bitcoin price watch analysis of the week. We are looking to move forward with our standard intraday strategy, but we are going to make a couple of slight alterations for the session. Why? Because we need to try and adapt to price action, and action has been pretty aggressive overnight. When things are aggressive like that, it necessitates a widening of our range, and a similar widening of our targets. When we widen out our targets, we are afforded an opportunity to go at price with a touch more risk, and so we can concurrently widen out our stops.
So, with this said, let’s get started.
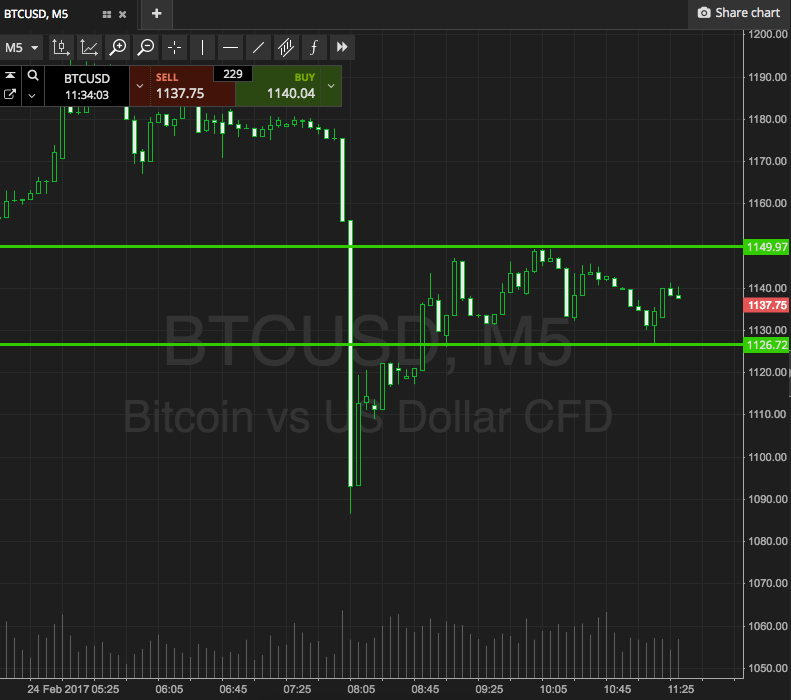
Action overnight, as we’ve said, was pretty volatile. We initially saw a run up towards the 1200 mark, and hovered in and around that level for a short while. However, price was unable to hold there, and we’ve since seen action fall back down in line with current levels, in and around 1130. We did see a bit of an overcorrection, a spike to the downside, and price carve out overnight lows at just short of 1090, but we’re going to disregard those for the time being.
So, in light of all this, take a quick look at the chart below in order to get an idea of where things stand right now, and where we are looking to get in and out of the markets today according to the rules of our intraday strategy. It’s a five-minute candlestick chart, and it’s got our key range overlaid in green.

As the chart shows, the range we are focusing on right now is defined by support to the downside at 1126, and resistance to the upside at 1149. We said it was wider than our normal parameters, and we weren’t lying!
If we see price break above resistance, we’ll be in long towards 1165. A close below support will put us in to a downside entry towards 1110.
Let’s see what happens.
Charts courtesy of SimpleFX


