So today we’re going to mix things up a little bit and kick off this analysis with a chart. The one below shows action overnight in the bitcoin price, and illustrates a long trade that signaled entry during early Asia, and one which we currently hold as a live position.
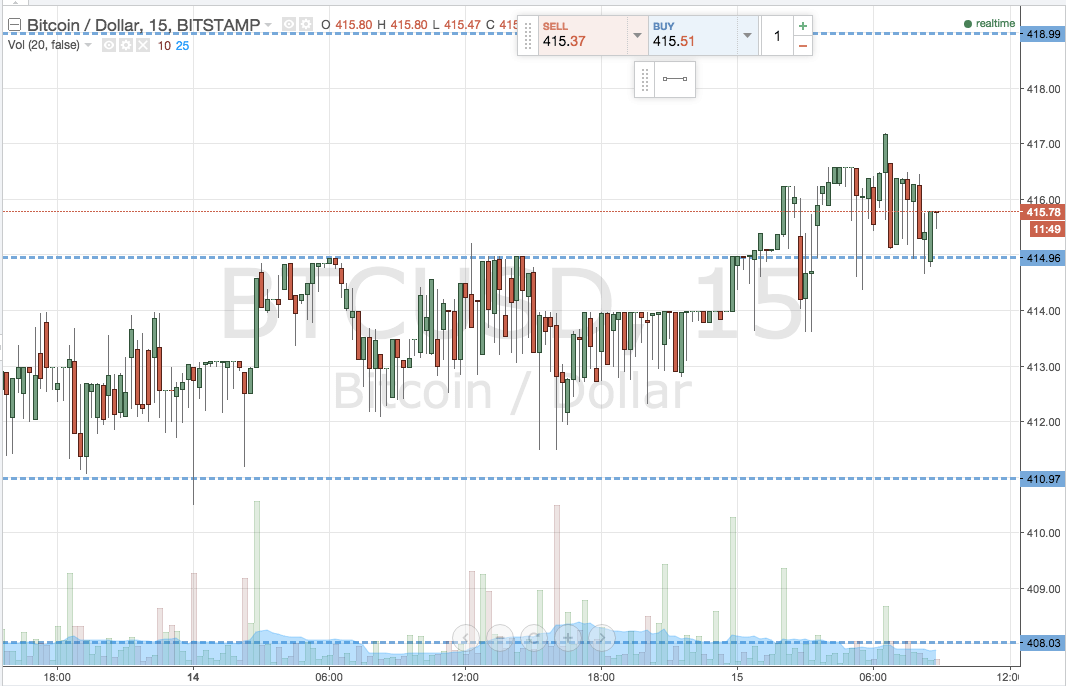

As the chart shows, we got in on a break of the level we slated as in term resistance in yesterday’s second analysis, and initially saw the bitcoin price run up towards our predefined target of 419 flat. Shortly after entering, however, price reversed, and we crossed back below broken resistance to trade within range. Fortunately, a matter of cents before our stop was taken out, price once again reversed to the upside, re-broke resistance, and has since been testing this broken resistance as support. Whether it will hold long enough for us to get a sustained run up towards our target remains to be see, but the longer it holds, the better things look, so for now, we’ll be staying out of the markets – at least until this trade resolves.
For those not yet in the market, take a quick look at the chart below to get an idea of a redefined range, and some entry frameworks.
As you can see, the redefinition is simply a case of shifting to the upside. In term support comes in at 414.79, while in term resistance holds at 417.23.
A close above in term resistance will signal a short term log entry towards 420 flat, with a stop at 416 defining our downside risk on the position.
A break and close below support will bring a short position to the table, towards an initial downside target of 411.46. Again, a stop is necessary, and somewhere in the region of 416 (circa current levels) looks good enough.
Happy Trading!
Charts courtesy of Trading View