Ok then things are starting to move as we right this, so instead of messing about and covering the previous night’s action in the bitcoin price, we’re going to get right in to things and set ourselves up for the day.
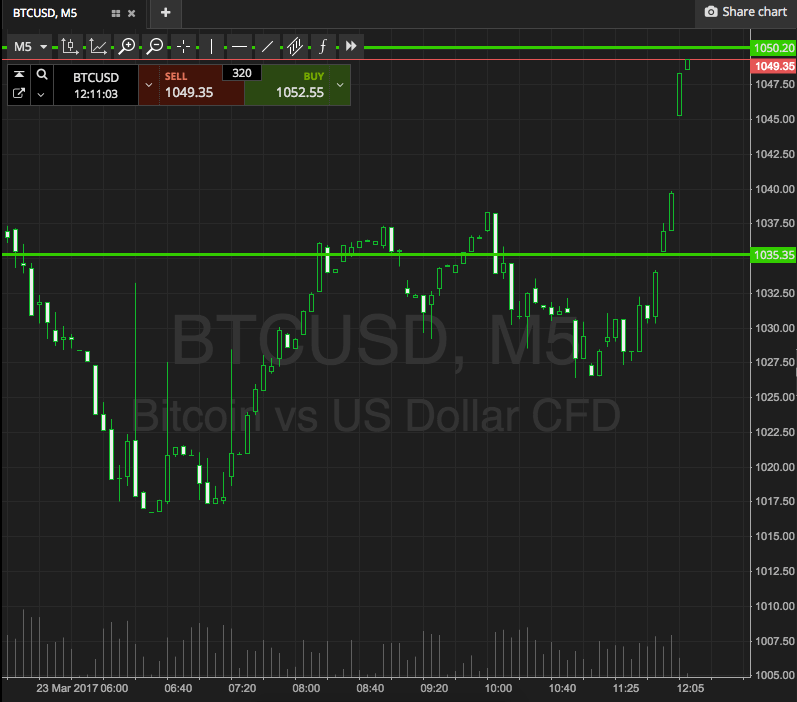
As ever, take a quick look at the chart below to get an idea of what’s on, what’s happening right now, and where we are looking to get in and out of the markets as price matures throughout the European session today.
The chart is a five-minute candlestick chart and (for those looking to catch up on what has happened so far this morning) displays something like the last five or six hours’ worth of action. Our range in focus is overlaid in green.

Ok, so as the chart shows, the range we are looking at today is defined by support to the downside at 1035, and resistance to the upside at 1050. Price just broke to the upside with a nice gap, and that’s where we are looking right now as a potential bias and – in turn – trade entry.
Looking at the upside entry first, then, we’re going to look at getting in to a long position on a break through resistance (assuming price closes above that level), and when we get in we’ll set a take profit (target) at 1065, and our stop loss comes in at 1045 to define risk, and ensure that we are taken out of the trade in the event of a bias reversal.
Looking the other way, if we close below support, we are going to get in short towards a downside target of 1025. Again we need a stop on the position, and somewhere in the region of 1039 looks like it should do the job nicely, and still give us enough room to avoid a chop out.
Charts courtesy of SimpleFX


