Reason to trust

How Our News is Made
Strict editorial policy that focuses on accuracy, relevance, and impartiality
Ad discliamer
Morbi pretium leo et nisl aliquam mollis. Quisque arcu lorem, ultricies quis pellentesque nec, ullamcorper eu odio.
The week has now drawn to a close out of Europe, and it’s time to put together our final analysis of the week. Action throughout today’s session has been pretty much as it has been across the entire week – that is, flat wit ha little bit of intrarange movement, but far from anything overtly tradable. We defined our range in this morning’s analysis with about eight or nine dollars to play with, and so intrarange has been an option throughout the day, but without any real sustained movement, we’ve not even been able to get in short term. With this in mind, we are going to have to approach this evening’s session out of Europe with pretty much the same parameters in focus. Over the weekend, the hope is that these parameters will come into play a little more aggressively, and that we can get in on a proper breakout trade.
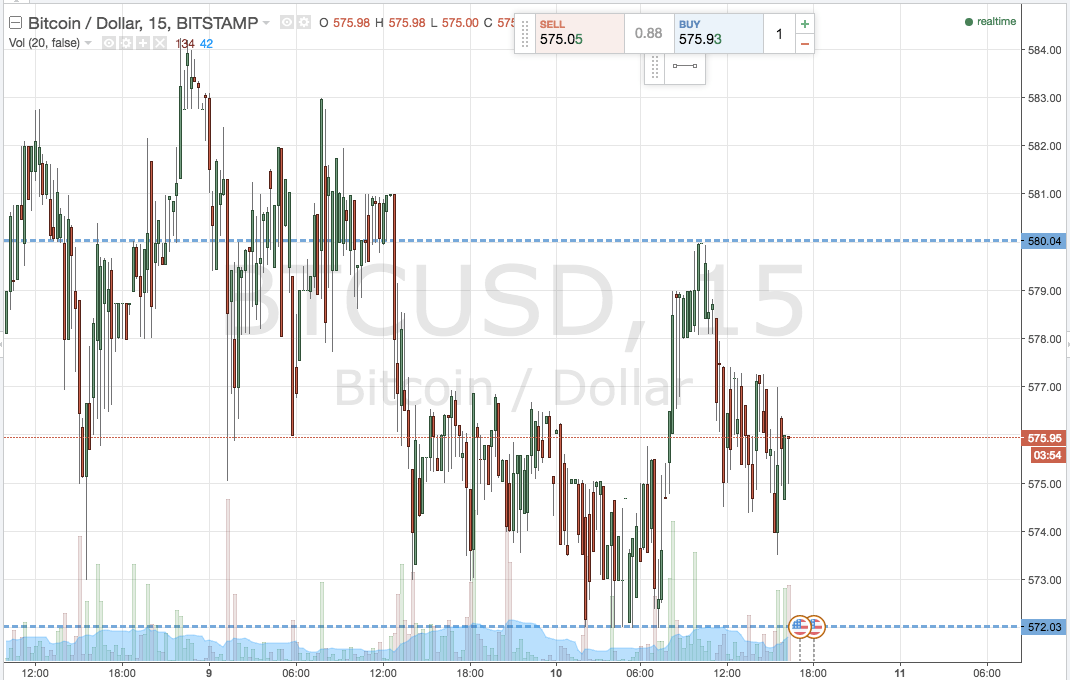
Until that point however, and until volume out of Asia kicks in properly, let’s take a look at what we are watching this evening. The chart below highlights the action seen throughout today’s session, and offers up our key levels going forward. It’s an intraday chart with a fifteen-minute candlestick timeframe, showing the last forty eight hours or so worth of action in the bitcoin price.
As ever, get a quick look at it before we get started.

So, as the chart shows, we are shifting support down slightly to 572, and in term resistance is also coming down a little bit to 580 flat. There’s enough room to go at action with an intrarange approach, but let’s keep things breakout for the purposes of this analysis.
Specifically, if price breaks above resistance, we will look to enter long towards an initial upside target of 585 flat. Looking short, if price closes below support, we will enter to the downside towards 565.
Charts courtesy of Trading View


