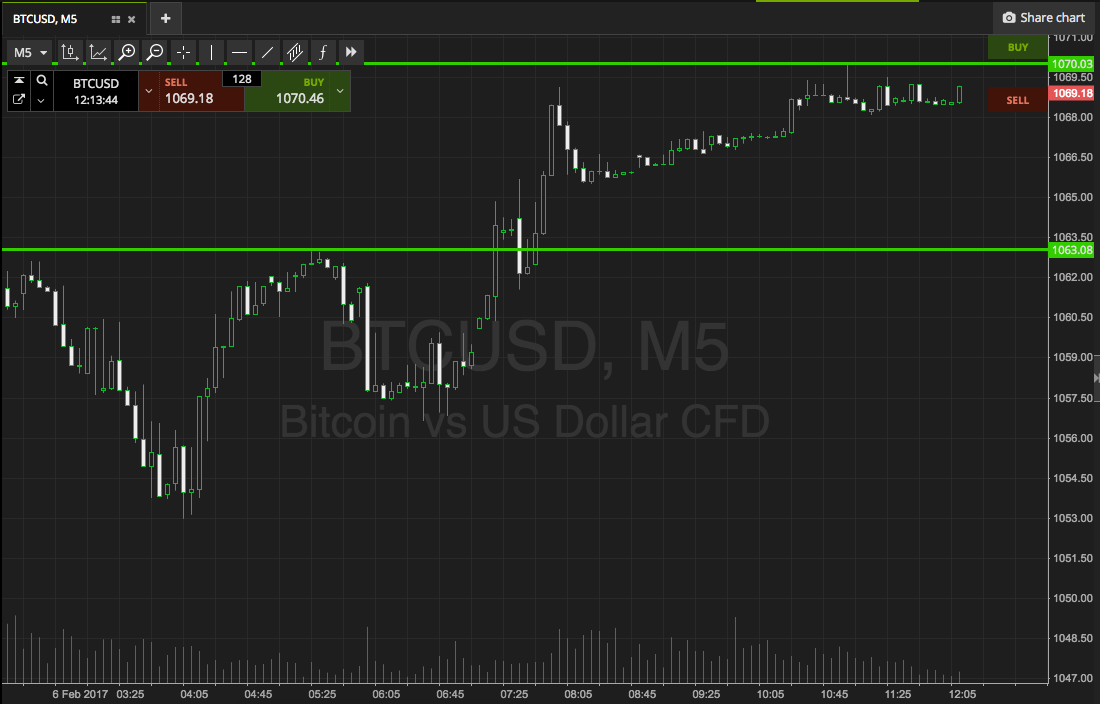
So that’s another weekend out of the way, and considering what we saw in the bitcoin price heading into the close of the week last week, things we’re relatively flat. In the second of our twice daily bitcoin price watch pieces on Friday, we noted that there looked to be plenty of volume pushing the markets throughout the day, and that this might be indicative of some weekend long volatility. As it turned out, this wasn’t the case. Things remained pretty inactive (at least, that is, from a price perspective) and we are heading into this week at pretty much the same levels around which we closed last.
So, we’ve not got too much to say heading into this week, but we do have some pretty solid levels to go at.
With that said, let’s get things moving for the day. Here’s a look at what we are focusing on, and where we intend to get in and out of the markets according to the rules of our intraday strategy. Take a look at the chart below to get an idea of what’s on, and what happened over the weekend.

As the chart shows, the levels in focus for this morning’s session is defined by in term support to the downside at 1063, and in term resistance at 1070. There’s not enough room for intrarange today, so we’ll be looking at things from a breakout strategy only for now. Specifically, of we see price break above resistance, we will look at getting in long towards an immediate upside target of 1080. A stop loss on the trade somewhere in the region of 1067 looks good.
Conversely, a close below support will put us in short towards 1055. A stop on this one at 1065 works well from a risk management perspective.
Let’s see how things play out.
Charts courtesy of SimpleFX


