It is early Thursday morning in Europe and we are about to kick off our day of trading in the bitcoin price. Things have been extremely volatile over the last 24 hours against a backdrop of some fundamental inputs (we are looking at you, SegWit2X) which wasn’t unexpected, but the specific impact of the inputs in question was – until it happened – difficult to predict.
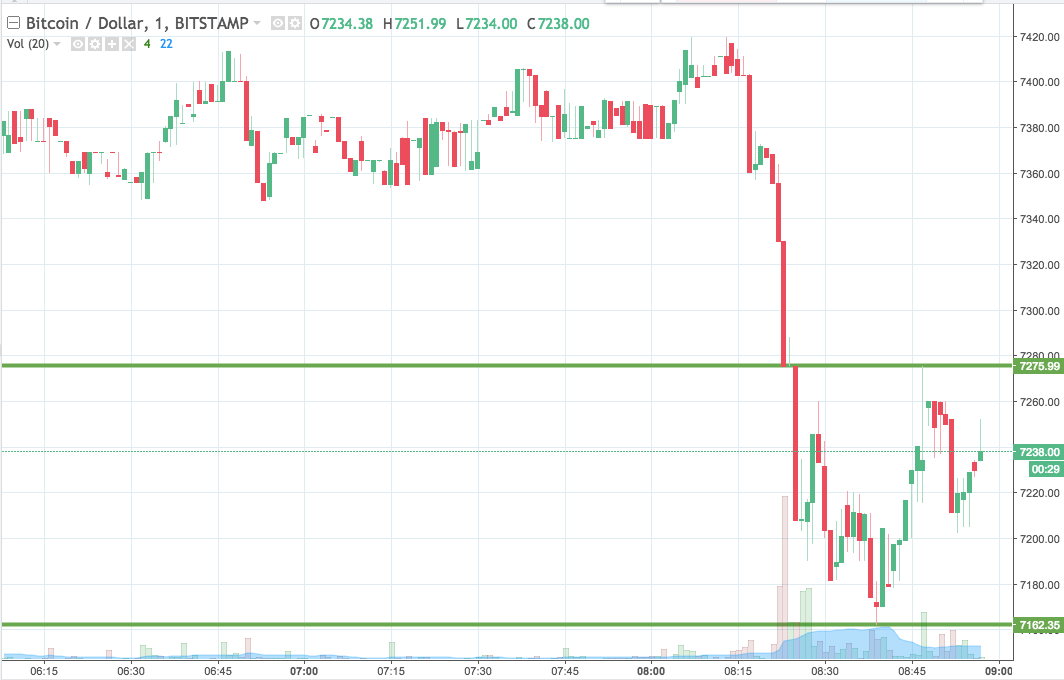
As it turns out, we saw a pretty steep decline in price early onThursday and, right now, price is consolidating in and around the lower quadrant of this price decline.
With any luck, as the day matures, we will see a degree of recovery and a back up towards the mid-7000s during the European session.
With this in mind, and as we move into the session today, here is a look at what we are focusing on in the bitcoin price and where we intend to try and jump in and out of the markets according to the rules of our intraday strategy. As ever, take a quick look at the chart below before we get started so as to get an idea where things stand and how price brought us to trade in and around current levels subsequent to overnight action.
The chart is a one-minute candlestick charts and it has our range overlaid in green.

As the chart shows, the range we are looking at for the session today comes in as defined by support to the downside at 7162 and resistance to the upside at 7275.
We will watch out for a close above resistance to validate an upside target of 7310. A stop loss on the trade at 7265 looks good.
Looking the other way, if price closes below support, we will enter short towards a downside target of 7110.
Let’s see how things play out.
Chart courtesy of Trading View


