So that’s another day done in our bitcoin price trading efforts and one that we’ve had some pretty good luck with. Things were a bit slow this morning and – as anyone who caught our initial coverage will already know – we were uncertain as to the likely direction of the markets given the overarching bearish momentum we saw over the weekend.
We were hoping that the decline would find a near term bottom and – as it turns out – we got exactly the opposite of what we were looking for. Price reversed shortly before midday in Europe and – after a short consolidation period – started to pick up. Almost immediately subsequent to this, however, we saw another turn to the downside and a spate of key levels haven’t managed to hold since.
The market is currently trading in and around 2050, which (as we noted this morning) is almost certainly low enough to keep general sentiment weak and to turn into a sort of self-fulfilling prophecy in terms of bringing more sellers to the fore.
Anyway, all we can do is trade what we see, so let’s get some key levels in place and try and pick up some profit from this evening’s action. As ever, take a quick look at the chart below before we get started to get an idea of what’s on and where things stand right now.
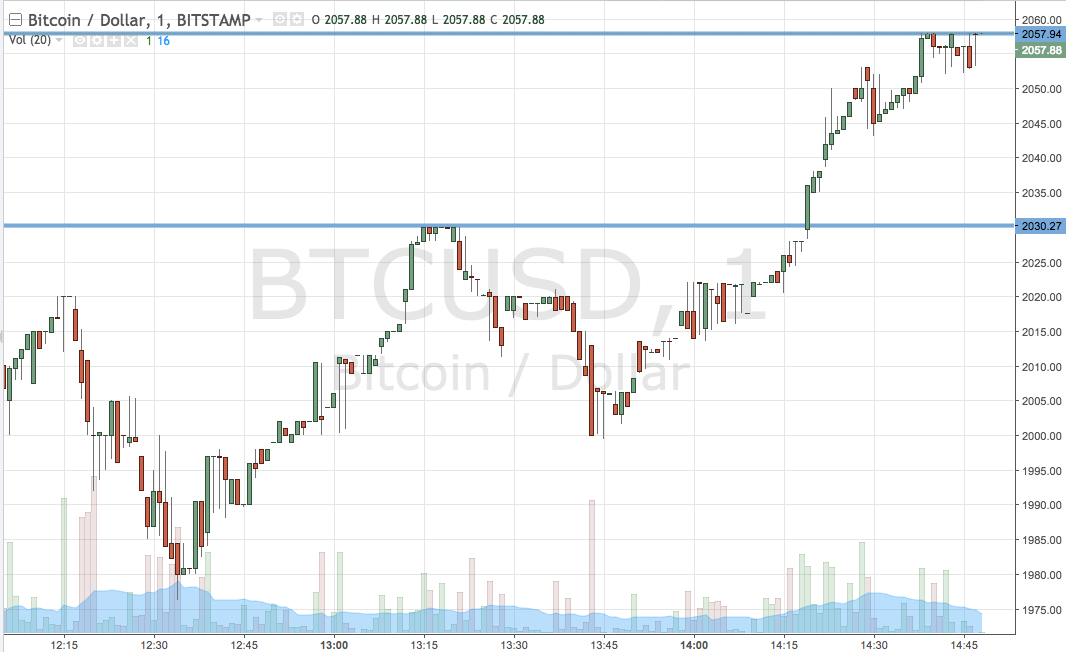
It’s a one-minute candlestick chart and it’s got our key range overlaid in blue.

As the chart shows, the range we are looking at comes in at support to the downside at 2030 and resistance to the upside at 2057. If we see a close above resistance, we’ll be in long towards an upside target of 2090. Looking short, a close below support will have us in towards a downside target of 2000 flat.
Let’s see what happens.
Charts courtesy of Trading View


