Regular readers will know we’re all about the short term intraday ranges in our bitcoin price watch analyses. Generally, we set up against the markets with a couple of key levels, as dictated by recent price action, and look to enter on a close above or below these key levels towards some relatively well defined (but always predefined) exit points.
Sometimes, however, it’s nice to mix things up a bit.
This evening, we’re going to do just that.
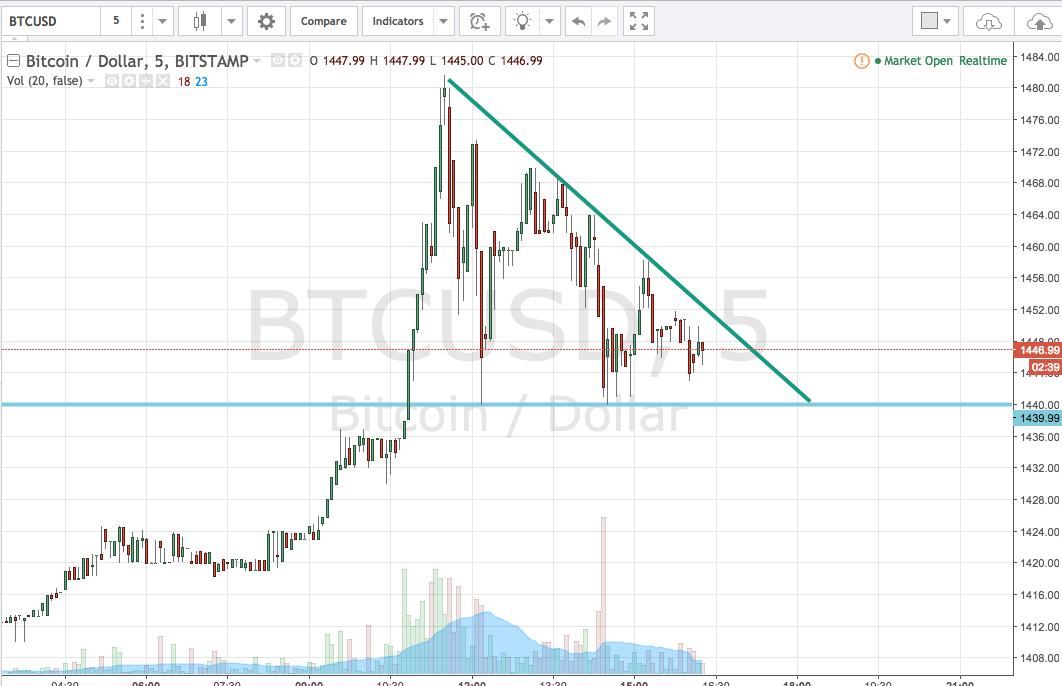
Take a quick look at the chart below before we get into the detail. As usual, it’s a five-minute candlestick chart, but it’s not got our standard intraday range overlaid – instead, we’ve got a classical charting pattern in play for the evening session.

So, as the chart shows, the pattern we’re looking at tonight is a triangle pattern. These are extremely common in the more established financial assets, and they serve up a couple of key characteristics with which we can dictate entries and exits. In this instance, we’re going to look primarily at the bullish entry.
What happens with these patterns, is price makes lower highs towards a repeat support level and consolidates towards the pattern point. In this instance, support is at 1439, and the current price is at 1448 or thereabouts.
As an entry signal, then, we’re looking for price to break out of the upper channel (the downward sloping triangle parameter) and close above the break. If we see this happen, we’ll enter long towards a target dictated by the height of the triangle. So, in this instance, we’ll be looking at targeting around $40.
As an example, if price closes above the channel around current levels, we’ll be in long towards an upside target of 1490. A stop just below support at 1439 (so a stop in or around 1430) will ensure we are taken out of the trade in the event of a price reversal.
Charts courtesy of Trading View


