In yesterday’s analysis, we noted that the run we have seen in the bitcoin price over the last week or so would likely see some degree of correction near term. That it continued through New Year is unusual in itself – we normally see an end of year correction in the more traditional financial assets as investors take profits off the table before the new year sets in. Bitcoin, it seems, is a little delayed in these traditional asset patterns, and it’s correction has taken few days longer than we might have expected. No big deal, juts something we’ve got to respond to now, instead of last week.
Action overnight was pretty volatile. We saw price run up to fresh highs in the 1075 arena, before dropping to where we currently trade, somewhere in the region of 1045-1050. It’s this area that’s going to define the early stages of today’s trading, giving us a pretty solid region to focus on as things get kicked off.
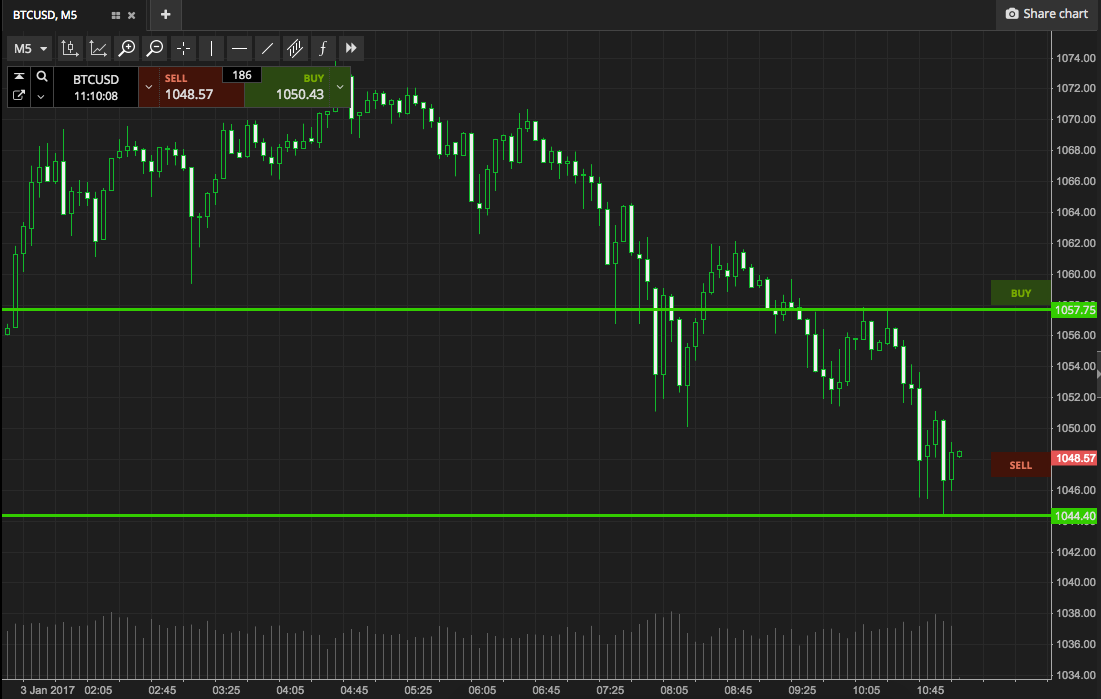
So, with this in mind, and as we shift into the European morning session today, here’s a look at what we are targeting, and where we are looking to get in and out of the markets on our intraday strategy. As ever, take a quick look at the chart below to get an idea what’s on. It’s an intraday chart with five minute candlesticks, and it’s got our range overlaid in green.

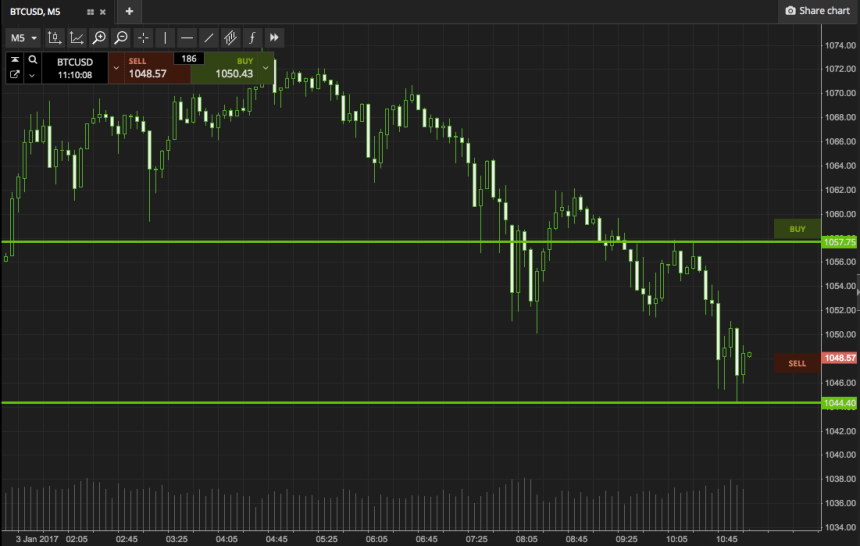
As the chart shows, the range for today’s session is defined by in term support to the downside at 1044, and in term resistance to the upside at 1057. It’s a pretty wide range, but we’re going to stick with breakout for now, as this looks like the most likely action given recent volatility.
Specifically, a close above resistance will put us in long towards an upside target of 1068. Conversely, a close below support signals short towards 1034.
Let’s see how things play out.
Charts courtesy of SimpleFX


