We have come to the end of the week in our bitcoin price trading efforts and – as far as weekly strategy implementation goes – it’s been a pretty tough one. While we have seen quite a lot of volatility spread across various sessions, this volatility has not necessarily been conducive to effective strategy execution. On a number of occasions we have gotten into trades and have been chopped out before any real action got underway and – as such – we are heading into what looks like it’s going to be one of the first net losses across a weekly period in a long time.
This is great, of course, but it is part and parcel of operating in markets like this and it is something we just have to take on the chin. As we head into the US session this evening, there are still likely to be a number of opportunities for us to get in and out of the markets and take a sneaky profit here and there, so before we give up for the week, let’s get some levels outlined with which we can carry forward into the session.
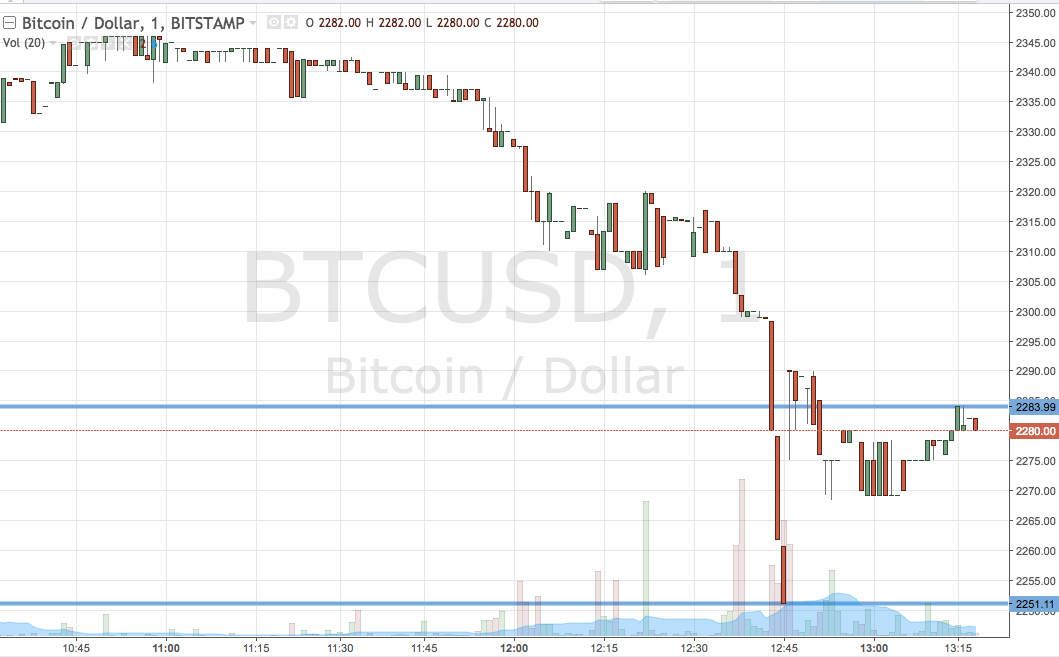
As ever, take a quick look at the chart below before we get started to get an idea of what is on and where things stand in the markets right now. It is a one-minute candlestick chart and it has our key range overlaid in green.

As the chart shows, the range we are focusing on for the session this evening is defined by support to the downside at 2251 and resistance to the upside at 2283. Standard breakout rules apply, so we will be in long towards an immediate upside target of 2310 if we get a close above resistance, while we will be in short towards a downside target of 2220 if price closes below support.
Let’s see how things play out and we will start afresh next week.
Charts courtesy of Trading View


