So the day has come to an end out of Europe, and it’s time to take the second of our twice daily looks at the bitcoin price. Things have been pretty good to us as late – we’ve had plenty of opportunities to get in and out of the markets according to our intraday strategy (well, the breakout scalp side of it, at least, not so much the intrarange approach) meaning we are looking almost certain to close out the week net positive on the bitcoin price markets. This is not guaranteed, of course. We might see some rough action this evening or as we head into Friday’s session and take a few stop hits on the day’s trading. So long as we keep our risk tight, however, and don’t break our own rules, it’s as close to a guaranteed winning week as we can get at this point.
We’ve got an evening session out of the US ahead of us, and beyond that, an Asian session to look at, before we get to tomorrow morning’s final two analyses. So, without further ado, let’s get to the details.
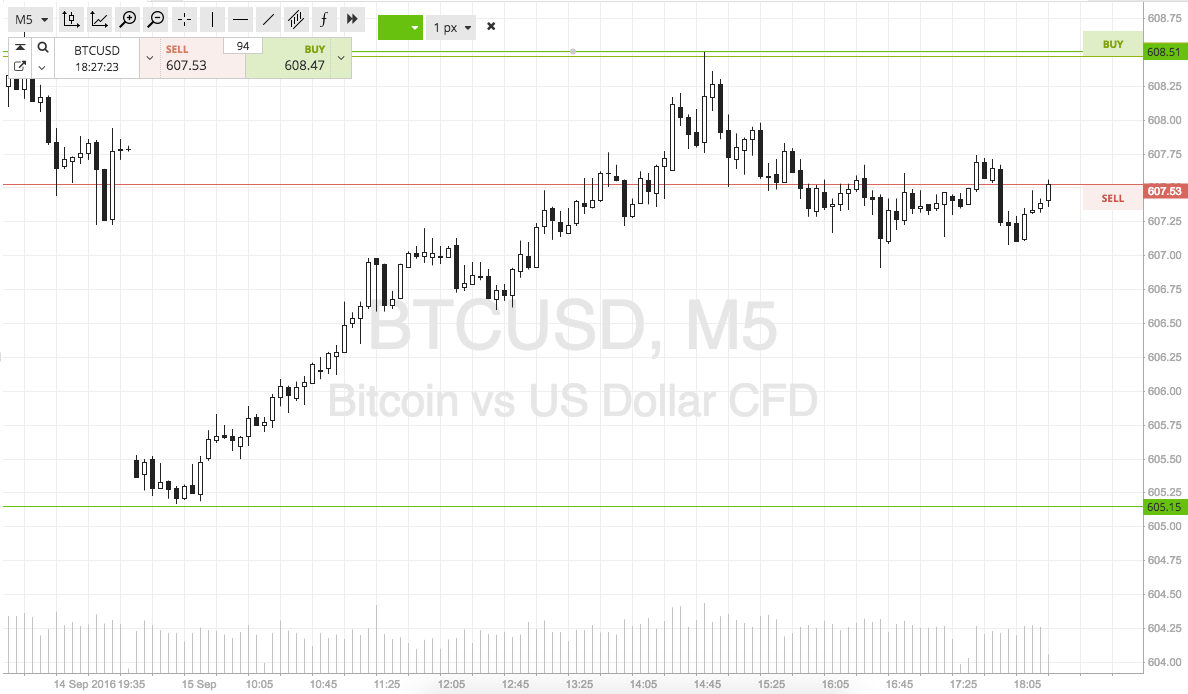
As ever, take a quick look at the chart below to get an idea of what’s on, and where we are looking to get in and out of the markets according to our intraday strategy. It’s a five-minute candlestick chart showing the last twelve hours (roughly the Asian and European session) with our range in focus highlighted in green.

As the chart shows, we are targeting in term support to the downside at 608 and in term resistance to the upside at 605. If we see price break through the the former, we will look to get in short towards 600. Conversely, if price breaks through resistance we will enter long towards 615. A stop on both positions just the other side of the entry keeps our risk tight on the trades.
Charts courtesy of SimpleFX


