We are a couple of days into a fresh week, and we have seen plenty of volatility so far in the bitcoin price based on Monday Europe/US and Asian session Tuesday morning action. With any luck, we will see a continuation of this action as we head into today’s European session, and can pull a profit from the market on the back of any breakouts or intrarange volatility that plays out.
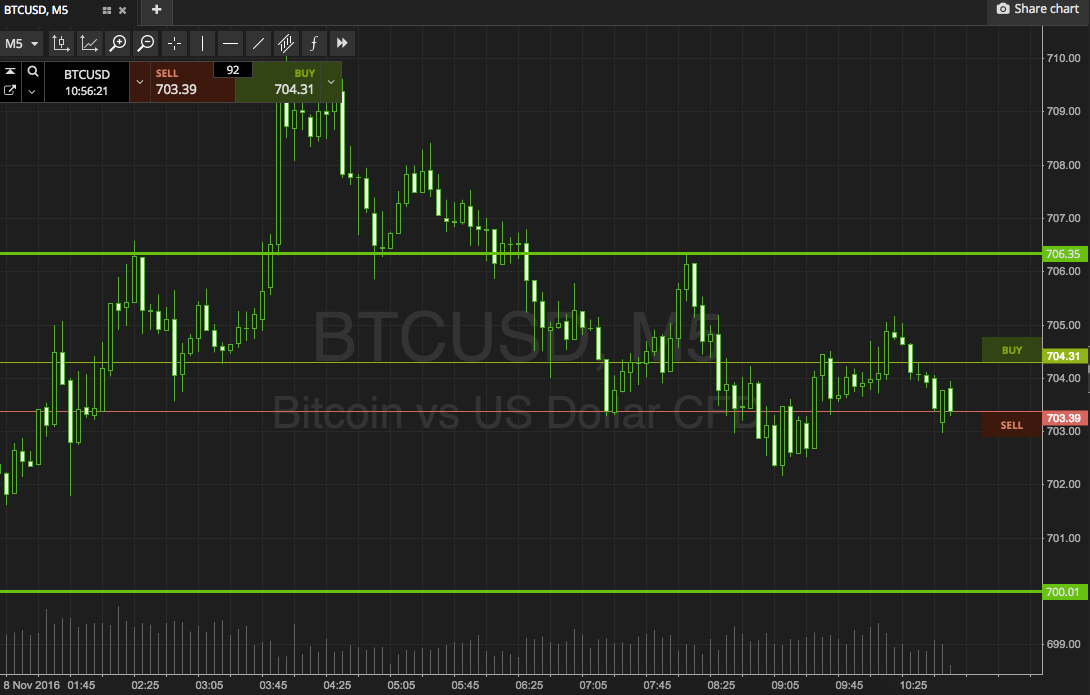
So, with this said, let’s take a look at what we’re focusing on in the bitcoin price for today, and see where we can get in and out of the markets according to our intraday strategy (or technically, strategies) to that aim. As ever, take a look at the chart below to get an idea of our levels in focus. It is a five-minute chart, showing the last 12 hours’ worth of action in the bitcoin price.

As the chart shows, the range in focus for today’s session is defined by 700 flat to the downside as support (this isn’t a price action dictated level, rather a psychologically significant one) and 706 to the upside as resistance.
It is a relatively narrow range, but there’s just about enough room to go at price with an intrarange strategy, so, long on a bounce from support with an immediate target of resistance to the upside, and short on a correction from resistance targeting support. Stop losses just the other side of entry will define risk.
Moving on to our breakout strategy, if price breaks through resistance, we will enter long towards an upside target of 710. A stop loss on this one somewhere in the region of 704 keeps our risk tight. Conversely, if price breaks through support, it will signal short towards 695. Again we need a stop loss, and somewhere in the region of 702 looks good.
Charts courtesy of SimpleFX


