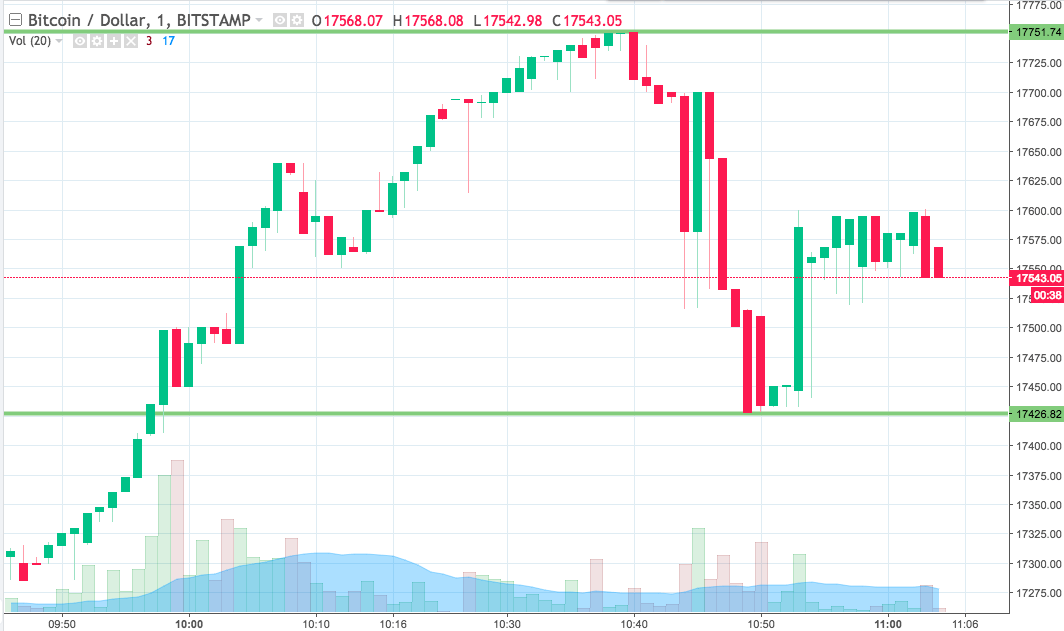
And that’s pretty much the week over in the bitcoin space, with things about to kick off for the early European session and calling for our penultimate intraday analysis. Overnight action in the bitcoin price was pretty strong, with BTC jumping to as high as 17,750 on some of the major exchanges before dipping slightly towards current levels.
It was this time last week (well, in a little while) that we saw price run towards 20,000, so we’d love to see something similar as this week draws to a close. Whether we will, is anyone’s guess.
All we can do is play the primary levels so let’s jump into action and see what we can put together.
As ever, take a quick look at the chart below before we get started so as to get an idea where thing stand and where we are looking to jump in and out of the markets as and when things move. The chart is a one-minute candlestick chart and it’s got our key range overlaid in green.

As the chart shows, then, the range we are looking at for the session this morning comes in as defined by support to the downside at 17462 and resistance to the upside at 17751. We will stick with our breakout approach for the time being, in anticipation of the sort of run that we have outlined above.
So, if we see price close above resistance, we will jump into a long trade towards an immediate upside target of 17830. A stop loss on the position at 17725 looks good from a risk management perspective.
Looking to the downside, we are going to look out for a close below support to signal a downside entry towards an immediate downside target of 17350. Stop at 17450.
Let’s see how things play out.
Charts courtesy of Trading View


