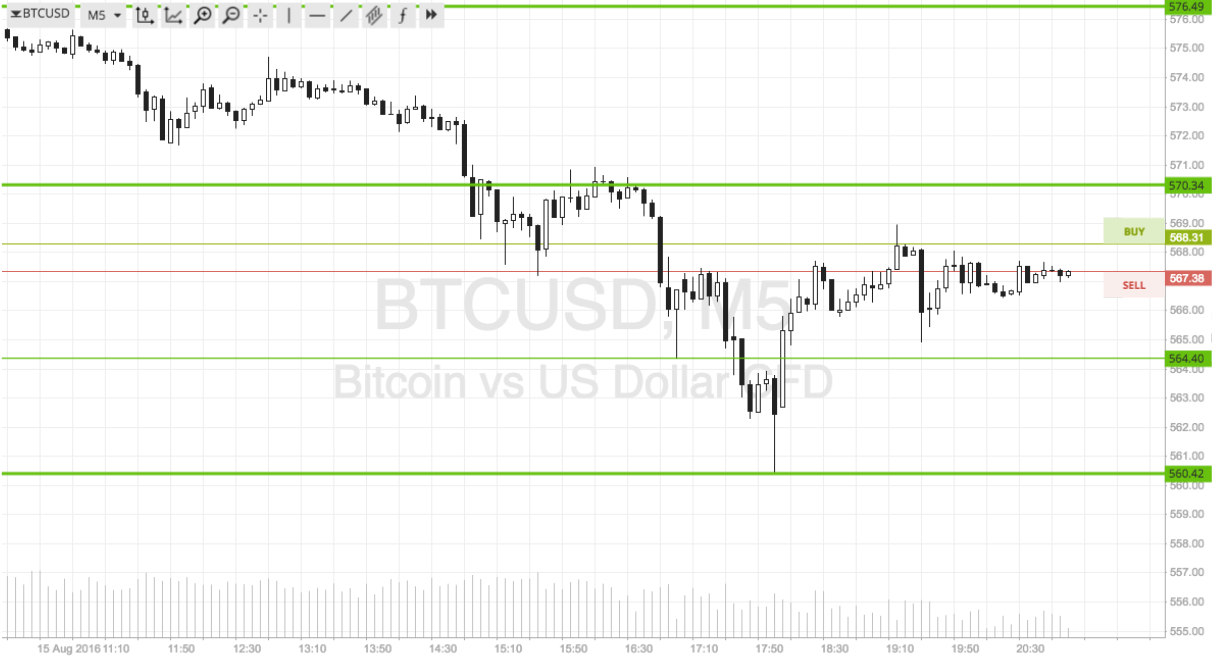
The European market is now closed, and it’s time to take a second look at the bitcoin price for today. In this morning’s analysis, we highlighted a range of around six dollars width, and suggested that we would focus on breakout scalp trades if priced managed to clear the range. Action has now matured for the day, and we did manage to get into one of these trades. The chart below highlights today’s action, and we have left this morning’s range highlighted in green so as to illustrate the trade. As the chart shows, price broke through support early evening, and we got in short. It took a while, and we got a test of retest of support as resistance, but eventually price broke down towards our target and we got taken out of the market for a take profit hit. We have now shifted our range to accommodate the latest action, and are looking to get into the markets again on the same strategy, but with slightly altered levels. So, as we head into tonight’s session, here is a look at what we are focusing on and where we are going to look to get in and out the markets according to our intraday strategy. As ever, take look at the above-mentioned chart to get an idea of our target range.

As the chart shows, the range we are now looking at is defined by support to the downside at 560 and resistance to the upside at 570. This is a nice $10 range, so an intrarange strategy is available – long at support and short at resistance targeting the opposing levels.
From a breakout perspective, a close above resistance signals long towards 576, with a stop at 568 defining risk. A close below support will signal a short entry towards an immediate downside target of 555. A stop loss on this one somewhere around 561 looks good.
Charts courtesy of SimpleFX


