Ok then, here we go – off on another day’s worth of trading in the Bitcoin price. Right now, it’s all about how long the correction is going to last. We’ve seen some degree of recovery so far this week, with price bouncing to current levels from over the weekend highs.
This bounce far from means we’ve got a full-scale turnaround, however. Price has been a bit volatile as late and we can’t take it for granted that the current run is a long-term upswing or a shorter term pullback.
Anyway, it doesn’t matter too much. It just means that we’ve got to keep things a little tighter (from a risk management perspective, that is) and make sure we don’t get caught on the wrong side of a longer term reversal.
So that’s the plan for today. Breakout entries as and when we see price run through one of our key levels (and secure a close above said levels) with tight stop losses taking us out of the positions if and when things get a little hairy.
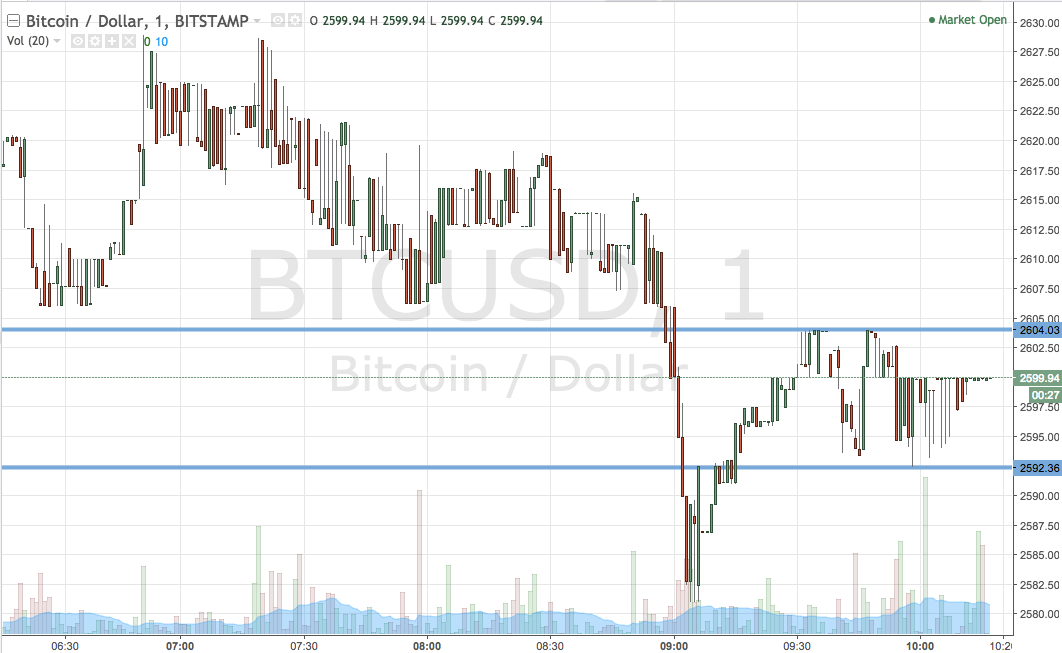
Let’s get to the detail. As ever, take a quick look at the chart below before we get things moving. It’s a one-minute candlestick chart and it’s got our key range overlaid in blue.

As the chart shows, then, the range we’re looking at right now is defined by support to the downside at 2592 and resistance to the upside at 2604. Our upside trade will signal when we see a close above resistance, and we’ll enter towards a target of 2630 initially. A stop at 2598 defines risk on the position.
Looking short, a close below support will have us in towards 2570. A stop at 2600 flat looks good on this one from a risk management perspective
Let’s see how things play out.
Charts courtesy of Trading View


