Sometimes, we outline our key levels in the bitcoin price, and then action throughout the day disappoints. Specifically, when this happens, we generally see a ranging of price between the two levels in question, and a failure to break either resistance or support and, by proxy, a failure of our strategy to put us in any profitable trades. As things have turned out today, that’s exactly what has happened. Price basically bounced around our key support level for a short period, before ranging slowly towards resistance.
We haven’t managed to get in or out of the markets according to the rules of our strategy at all, and as such, we remain net flat heading into this evening’s session out of Europe.
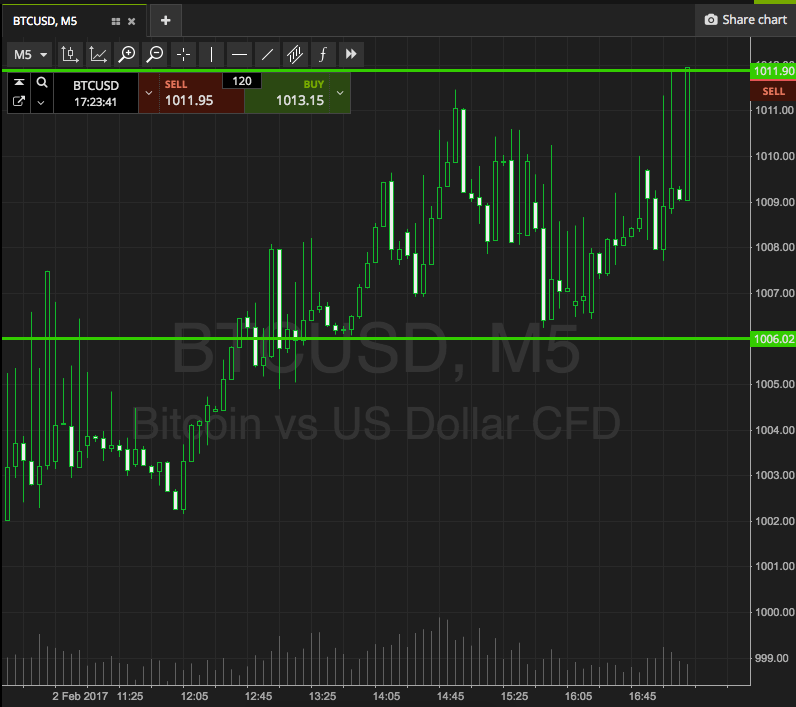
Anyway, we won’t complain about it. Let’s move forward and see if we can outline some key levels for this evening’s session, and see if we have any better luck this time around. As ever, take a quick look at the chart below before we get started. It is a five-minute candlestick chart, and it has our key range overlaid in green. 
As the chart shows, the range in focus is defined by support to the downside at 1006, and resistance to the upside at 1011.
This is a far tighter range than normal, so we will be looking at breakout only this evening. Intrarange is only really available when we have slightly wider parameters than we do here.
So, if we see price break above resistance, we will look to get in a long position towards an immediate upside target of 1020. A stop loss on this trade at 1008 will ensure we are taken out of the position in the event of a bias reversal. Looking short, if we see price close below support, it will put us in a downside entry towards a target of 995. A stop loss on this one at 1009 kills off any risk concerns.
Charts courtesy of SimpleFX


