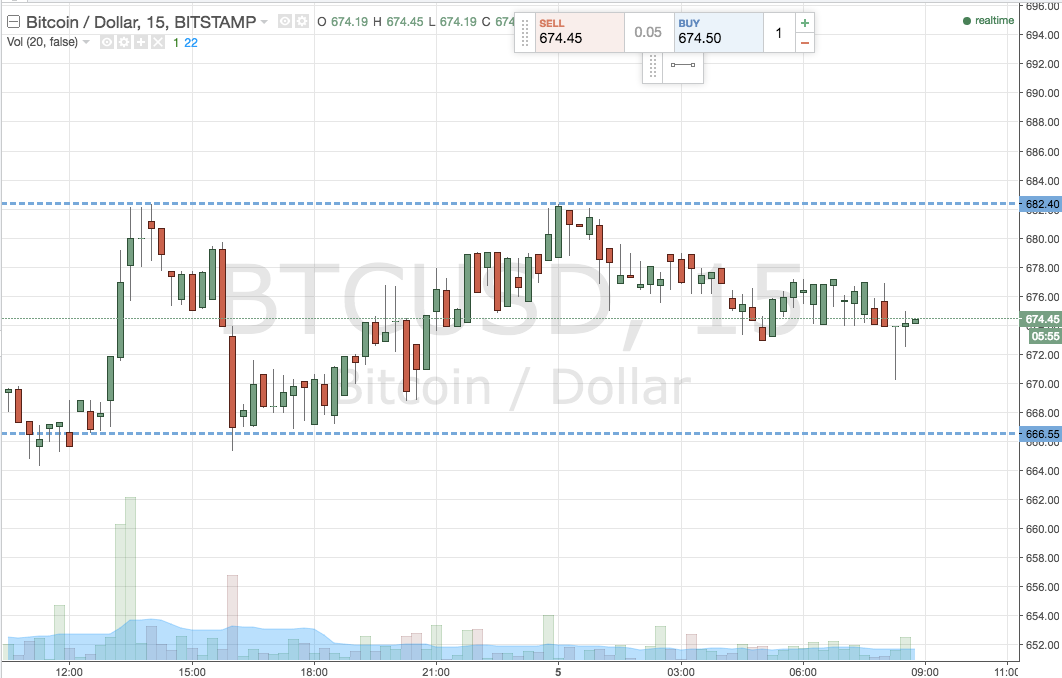
Perhaps unsurprisingly, action overnight in the bitcoin price was relatively muted. The federal holiday in the US led to a pretty soft volume level, and this eradicated any real chance of sustained momentum. We did see a couple of quick trades complete yesterday on short-term volatility, in line with our intraday scalp strategy, but nothing to write home about. Anyway, all that is behind us now. We have a fresh week (effectively) of trading this week, and the US back in full swing in a couple of hours, volume should start to pick up once more. So, with this said, and as we head into today’s European morning session, what are we looking at in the bitcoin price, and when we look to get in and watch the markets according to our intraday strategy in order to try and draw profit from any action? Let’s take a look. As ever, have a look at the chart below to get an idea of the primary levels in focus. The chart is a 15 minute candlestick chart, showing the last 24 hours worth of (albeit flat) action.

As the chart shows, we are widening out our range a little bit, especially when compared to yesterday morning’s parameters. For today, we have support to the downside 666, and we are shifting resistance to the upside at 682. There is plenty of room for intrarange trading on this one, so long at support and short at resistance to take advantage of action between our primary parameters.
From a breakout point of view, a close above 682 will signal a long entry towards an initial upside target of 690. A stoploss on this one somewhere in the region of 678 defines risk. Conversely, and looking to the downside, a close below support on the intraday chart will put us in a short trade towards 652.
Happy Trading!
Charts courtesy of Trading View


