After last week’s volatility, we expected that – this week – we might see some level of action in the bitcoin price. We are now closing in on the close of the week, with the start of the early morning session out of Europe on Thursday, and the week hasn’t quite played out as we’d hoped. We have seen some level of sustained volatility – Tuesdays decline carried through to fresh lows and we managed to get in on a short entry based off this action – but since Tuesday evening, things have been relatively flat. We have traded within a relatively tight range (circa $10) and not really seen any actionable breakouts. We were chopped out of a trade yesterday, but only for a small loss, and we headed into last night’s session net flat on the market. Based on action overnight, we remain net flat, having not entered any positions to now.
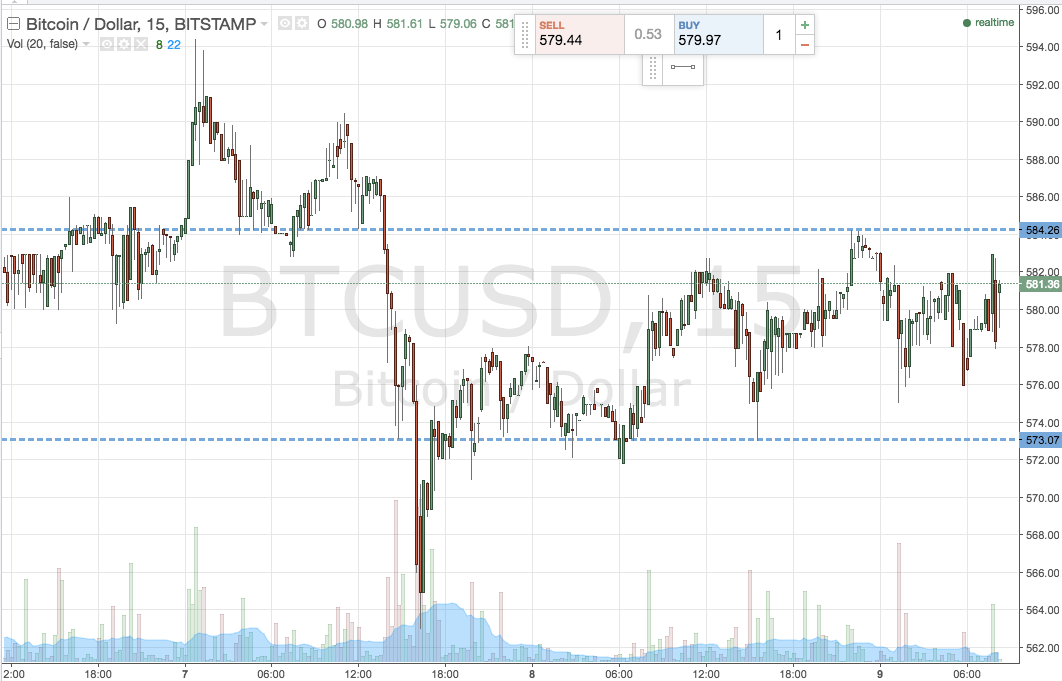
So, as we head into today’s session, where are we looking to get in and out of the markets according to our intraday strategy, and where will we define our risk management parameters? As ever, take a quick look at the chart below to get an idea of the levels we are focusing on. It is an intraday, 15-minute candlestick chart showing the last 24 hours or so worth of action.

As the chart shows, the levels we are looking at today are in term support at 573 and resistance to the upside at 584. Once again, this gives us about a $10 range to play with, so intrarange is a valid strategy. Looking at breakout, if price closes above resistance we will enter longer towards an upside target of 590. Conversely, if price breaks below support, we will look to enter short towards 566. A stop loss on both trades just the other side of the entry will keep things tight from a risk management perspective.
Happy trading!
Charts courtesy of Trading View


